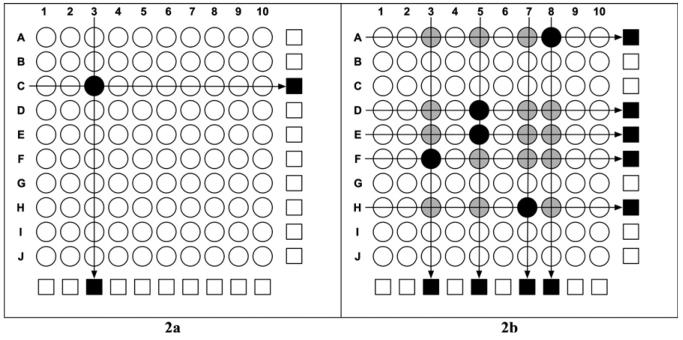
Figure 2.
Specimen pooling strategy using malaria-positive samples to represent 1% and 5% malaria prevalence rates. A, Two pools (black squares) tested positive, and the matrix identified the single malaria positive sample (black circle). B, The positive pools (black squares) led to further testing of individual samples (black and gray circles) and identification of five malaria-positive samples (black circles).

