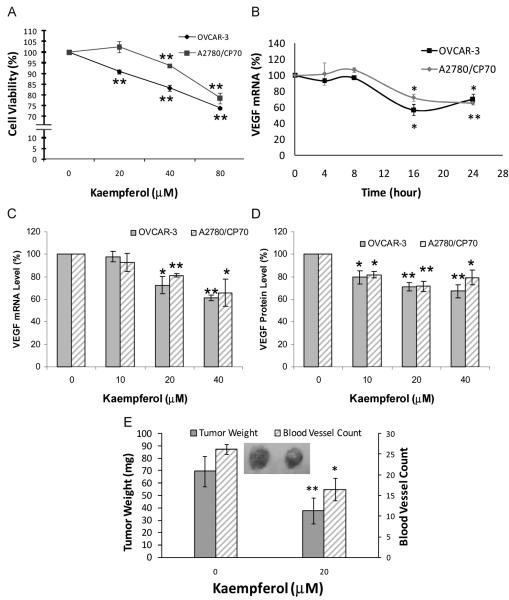
FIG. 1.
Kaempferol’s effect on cell viability, VEGF expression, tumorigenesis, and angiogenesis in ovarian cancer cell lines. A: Cells (8 × 10³/well) were seeded in 96-well plates, incubated for 16 h, and treated with kaempferol for 24 h. Cell viability was colorimetrically determined by a MTS-based method and expressed as percentages of control. Data represents mean ± SE from 3 independent experiments. B: Cells (5 × 10⁵) were seeded in 60-mm dishes, incubated 16 h, and treated with 40-μM kaempferol for 0 to 24 h. Cells were harvested in TRIzol Reagent and stored in −80 °C until analysis. RNA was extracted; reverse transcribed with AMV reverse transcriptase; and quantitated by SYBR Green-based, real-time PCR. VEGF mRNA levels were normalized by GAPDH abundance and expressed as percentages of control. Data represents mean ± SE from 2 independent experiments. C: Cells (5 × 10⁵) were seeded in 60-mm dishes, incubated 16 h, and treated with 0 to 40 μM kaempferol for 24 h. RNA was extracted with TRIzol Reagent, reverse-transcribed with AMV reverse transcriptase, and quantitated by SYBR Green-based, real-time PCR. VEGF mRNA levels were normalized by GAPDH abundance and expressed as percentages of control. Data represents mean ± SE from 3 independent experiments. D: Cells (8 × 10³/well) were seeded in 96-well plates, incubated for 16 h, and treated with kaempferol for 24 h. Culture supernates were collected and analyzed for VEGF165 by ELISA, and cell numbers were determined by MTS-based assay. VEGF levels were normalized by cell numbers and expressed as percentages of control. Data represents mean ± SE from 4 independent experiments. E: OVCAR-3 cells (3 × 10⁶) were suspended in 100 μ l serum-free medium at 4°C, mixed with 50 μl cold BD Matrigel, supplemented with or without 20-μM kaempferol at 4°C, implanted in the chorioallantoic membrane of 9-day-old chicken embryos, and incubated for 5 days at 37.5°C before tumors were weighed and counted for blood vessels. Data represents mean ± SE from 5 chicken embryos. *P < 0.05 as compared to control. **P < 0.01 as compared to control.

