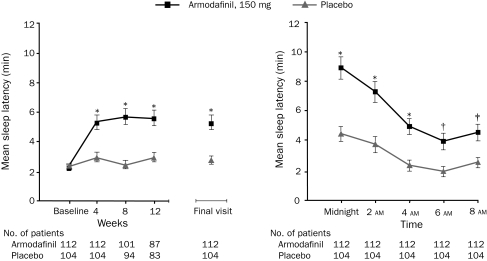
FIGURE 2.
Mean sleep latency on the Multiple Sleep Latency Test (MSLT). Sleep latency by visit for the last 4 tests (2-8 am) (left) and during the final visit night shift (midnight to 8 am) (right). Error bars indicate SEM. P values are based on the change from baseline compared with placebo. *P<.001, †P<.01, and ‡P<.05.

