Figure 3.
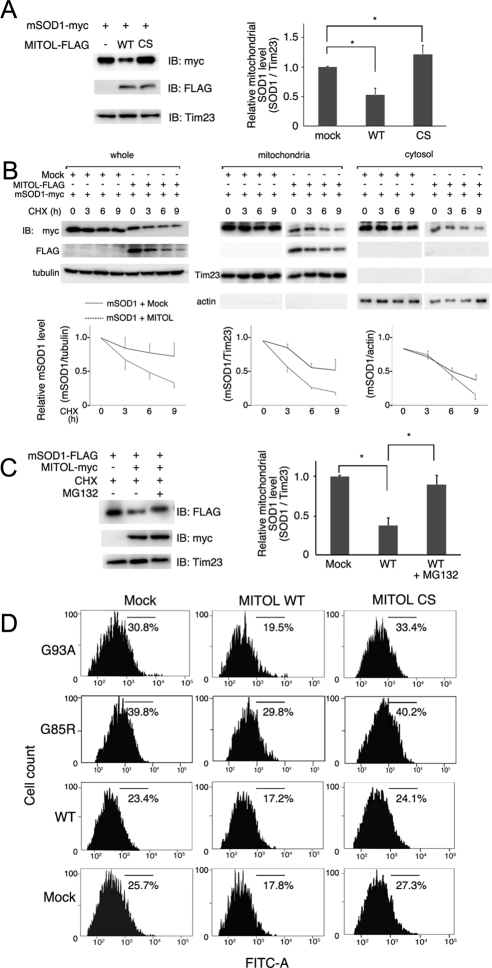
MITOL overexpression promotes mSOD1 degradation. (A) MITOL overexpression decreases the amount of mSOD1 in mitochondria. Mitochondrial fractions isolated from Neuro2a cells transfected with indicated vectors were immunoblotted with anti-myc, anti-FLAG, or anti-Tim23 antibody. The relative protein level of mSOD1 with or without MITOL was quantified by densitometry (right). Error bars, SD (n = 3). * p <0.05; Student's t test. (B) Cycloheximide (CHX)-chase assay indicates the rapid degradation of mSOD1 at mitochondria by MITOL overexpression. Neuro2a cells transfected with indicated vectors were treated with CHX (10 μg/ml) for indicated times, and each lysate of whole, mitochondrial, or cytosolic fractions was immunoblotted with indicated antibodies. The relative protein levels of mSOD1 were quantified by densitometry (bottom panels). Solid and broken lines indicate the cotransfection with mock or MITOL, respectively. Error bars SD (n = 3). (C) Degradation of mSOD1 through the ubiquitin-proteasome system. Neuro2a cells transfected with indicated vectors were incubated with CHX (10 μg/ml) with or without MG132 (50 μM) for 3 h. The relative protein levels of mSOD1 were quantified by densitometry. Error bars, SD (n = 3). * p < 0.05; Student's t test. (D) mSOD1-dependent ROS generation was reduced by MITOL WT, but was enhanced by CS mutant. Twenty-four hours after cotransfection of Neuro2a cells with indicated vectors plus pDsRed-Mito, cells were incubated in differentiation medium for 24 h. Intracellular ROS generation in DsRed-Mito–positive Neuro2a cells was measured by flowcytometric analysis using H2DCFDA staining. These represented results were from one of three experiments that produced similar results.

