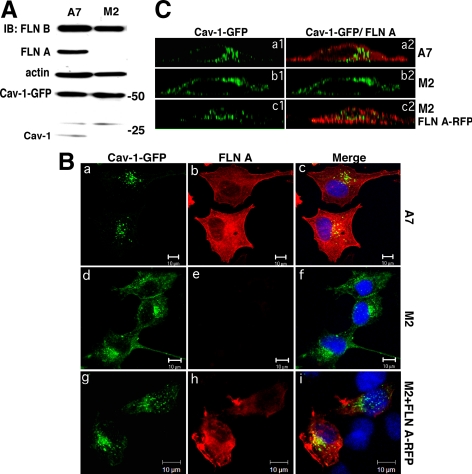
Figure 6.
Cav-1-GFP distribution in M2 and A7 cells. (A) Western Blot analysis of M2 and A7 cell lysates confirmed expression of FLN A in A7 cells and the lack of FLN A in M2 cells. The level of expression of FLN B and actin was similar in both cell lines. In A7 cells, endogenous Cav-1 expression was also observed, albeit ∼10-times lower than the level of Cav-1-GFP. (B) M2 (a, b, c, g, h, and i) and A7 cells (d–f) were transfected with Cav-1-GFP alone (a and d) or cotransfected with FLN A-RFP (g–i), fixed 24 h after transfection, and stained with FLN A mAb (b, e, and h). Merged images also show DAPI nuclear staining (c, f, and i). Bars, 10 μm. Cav-1-GFP distribution was more punctate and internalized in A7 cells and M2 cells cotransfected with FLN A-RFP and diffusely membrane-associated in M2 cells. (C) Z-axis deconvolved orthogonal projection images of A7 (a1 and a2) and M2 (b1, b2, c1, and c2) cells transfected with Cav-1-GFP (b1 and b2) or cotransfected with Cav-1-GFP and FLN A-RFP (c1 and c2). Merged images show Cav-1-GFP and FLN A staining (a2, b2, and c2). A7 cells and M2 cells expressing FLN A-RFP showed clustered and internalized Cav-1-GFP, whereas in M2 cells Cav-1 was localized to the plasma membrane.

