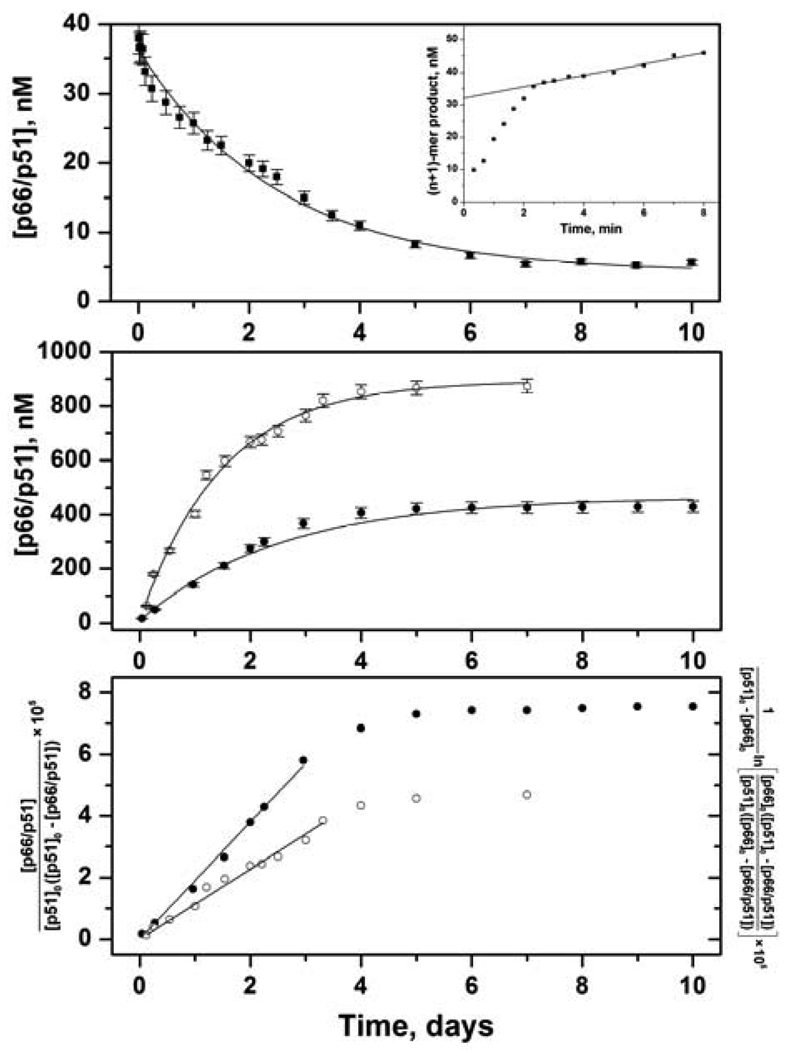
FIGURE 1.
Kinetics of RT subunit dissociation and association monitored by pre-steady-state activity assay. Error bars are standard deviations of at least 3 experiments. (upper panel) Dissociation of 50 nM p66/p51 at various times (■) fit to eq 2 (solid line). Inset shows a time course of single nucleotide addition to DNA substrate. Slope of line is steady-state rate kss; intercept is burst amplitude B = [p66/p51] / 2. (middle panel) Association of 0.5 µM p66, 0.5 µM p51 (●) and 0.5 µM p66, 2.5 µM p51 (○) fit to eq 5 (solid lines). (lower panel) Association of 0.5 µM p66, 0.5 µM p51 (●) fit to eq 3 and 0.5 µM p66, 2.5 µM p51 (○) fit to eq 4.

