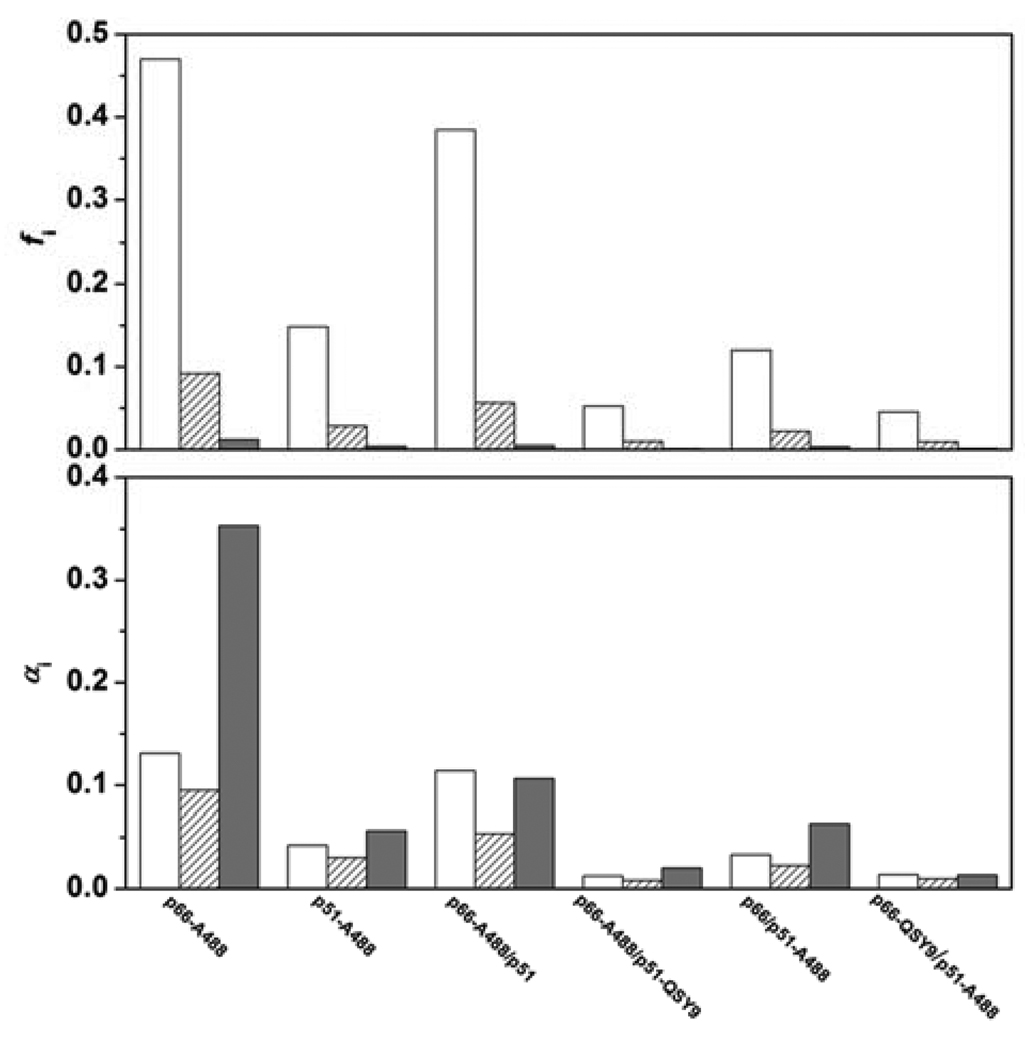
FIGURE A1.
Fractional intensities and amplitudes of 3.6-, 1-, and 0.05-ns decay components of A488-labeled RT monomers and heterodimers. 3.6-ns component (open bars), 1.0-ns component (hatched bars), and 0.05-ns component (filled bars). (upper panel) Fractional intensities calculated from data in Table A2 using eq 9. (lower panel) Amplitudes normalized to the steady-state intensity of N-acetylcysteine-A488 at 540 nm.

