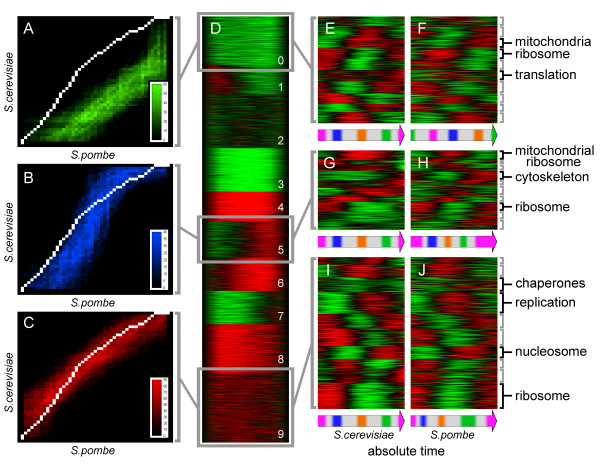
Figure 3.
Heterochrony of gene expression. (A-C) Examples of clusters of individual alignment paths (red, blue and green - different time clusters) in comparison with the global alignment path (white line). Color intensity on the histograms indicates number of individual alignment paths crossing specific matrix locations. (D) All individual alignment paths clustered using Cluster3 software. Grey boxes indicate clusters selected for matrix representation on A, B and C. (E) Results of consequent clustering of S. cerevisiae expression profiles, corresponding to genes present in the time cluster 0 (panels A, D). (F) S. pombe orthologs corresponding to the profiles in E. (G) Results of consequent clustering of S. cerevisiae expression profiles, corresponding to genes present in the time cluster 5. (H) S. pombe orthologs corresponding to the profiles in G. (I) Results of consequent clustering of S. cerevisiae expression profiles, corresponding to genes present in the time cluster 9. (J) S. pombe orthologs corresponding to the profiles in I. Timelines below the panels E-J demonstrate alternative phase shifts in the expression of S. pombe orthologs. Functionally related genes are marked with black brackets on the right side.

