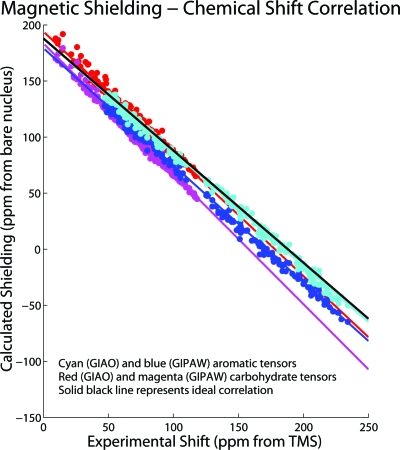
Figure 5.
Different methods were employed to predict the shift result and result in unique trend lines for the 13C shielding-shift correlation plots. The linear fit parameters can deviate significantly from their ideal values (solid black line) of −1 for slope and 188 ppm for the 13C shielding of TMS reference for the different levels of theory and can be dependent on the bonding type of the molecules. While the 13C shielding-shift correlation for the lattice-including GIPAW PBE∕Fine (blue and magenta) method shows an improved scatter over the GIAO PBE1∕6-31G(d) method (cyan and red), the divergent trend lines for the carbohydrate and aromatic tensors are apparent.

