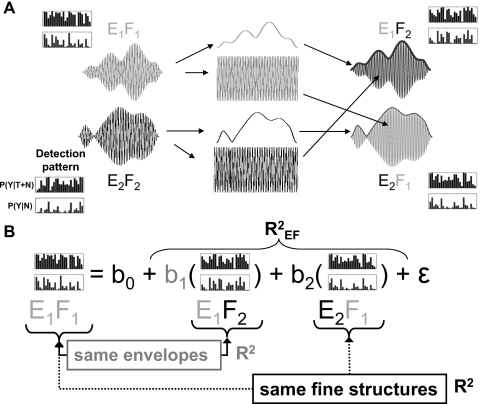
Figure 1.
(A) Schematic illustration of the stimulus-construction procedure. Envelopes (e) and fine structures (f) were separated from the E1F1 and E2F2 stimulus sets using the Hilbert transform. The envelopes and fine structures were exchanged and recombined to create chimeric stimulus sets E1F2 and E2F1. Detection patterns are shown to remind the reader that each stimulus wave form illustrated is a single member of an entire set of wave forms. A more detailed description of the stimuli (including distortion-control procedures) is given in the text. (B) Illustration of the multiple regression procedure for the E1F1 stimulus sets. Chimeric detection patterns sharing envelopes (E1 in the example above) and sharing fine structure (F1 above) were used to predict the detection pattern residuals (see text) for the base line stimulus set (E1F1 above). The b coefficients represent the slopes of the regression lines used in the multiple regression statistical model and also indicate how strongly the subject weighted the information associated with that cue. The b0 coefficient is always equal to zero because variability linearly associated with the base line stimulus set not in the model (E2F2 above) was removed (see text for details). The ε term represents error variance. R2 values were computed for envelope (gray), fine structure (black), and a linear combination of envelope and fine structure . If envelope completely dominated the detection process, it was expected that the E1F1 and E1F2 detection patterns (and the related patterns of residuals) would be the same and the . If fine structure completely dominated the detection process, it was expected that the E1F1 and E2F1 detection patterns (and residuals) would be the same and the .

