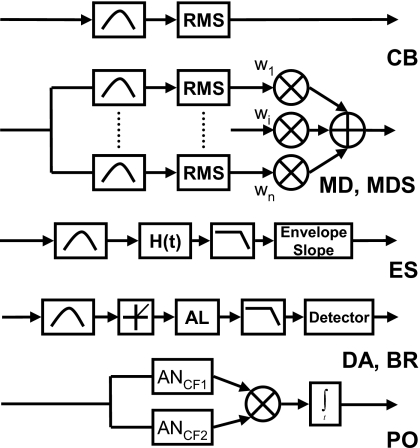
Figure 1.
Block diagrams of the models used to predict N0S0 detection patterns. The models listed from top to bottom are CB, critical band (Fletcher, 1940); MD, multiple detector with fit weights (Ahumada and Lovell, 1971; Ahumada et al., 1975; Gilkey and Robinson, 1986); MDS, multiple detector with suboptimal (independent channel) weights; ES, envelope slope (Richards, 1992; Zhang, 2004) DA, Dau model (Dau et al., 1996a); BR, Breebaart model (Breebaart et al., 2001a); PO, phase opponency (Carney et al., 2002). H(t) denotes the Hilbert transform used to recover the absolute value of the complex-analytic signal. AL denotes the adaptation loops as described in Dau et al. (1996a). AN denotes the auditory-nerve model of Heinz et al. (2001).

