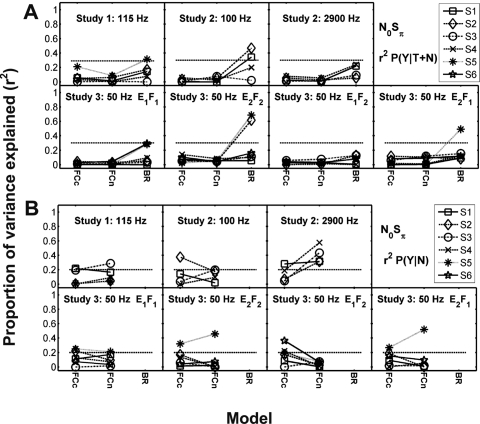
Figure 9.
Proportion of variance explained (r2) by N0Sπ model predictions for z-scores of (A) P(Y∣T+N) and (B) P(Y∣N). Model abbreviations are FCc, FC model using an UCC for simulated peaker channels (i.e., channels with ITD curves that are characterized by a central peak); FCn, FC model using a NCC for peaker channels; and BR, the binaural Breebaart model. Different subjects are indicated with different symbols connected across models to facilitate intersubject comparisons. Note that subjects sharing the same number do not correspond across studies, but corresponding symbols are used in Figs. 67. Symbols are connected to facilitate comparisons across models. The critical r2 value for reaching a significant prediction (p<0.05), including a Bonferroni correction for comparison of each data set to 11 models for P(Y∣T+N) (across Figs. 69A), is 0.29 for Study 1 and 0.30 for Studies 2 and 3, and including a correction for comparison to two models for P(Y∣N) (Fig. 9B) the critical r2 value is 0.20 for all three studies, as indicated by the horizontal dashed lines.

