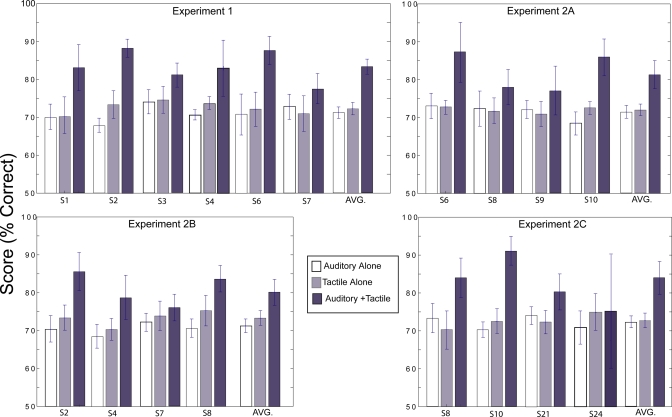
Figure 2.
Summary of results for baseline condition in Experiments 1, 2A, 2B, and 2C. Percent correct scores for the individual subjects in each experiment are averaged across multiple repetitions per condition; number of repetitions varies by subject and is equal to or greater than 4 per subject. AVG is an average across subjects and repetitions in each experiment. White bars represent A-alone conditions, gray bars represent T-alone conditions, and black bars represent the A+T baseline condition with SOA=0 ms and phase=0°. Error bars are 2 SEM.

