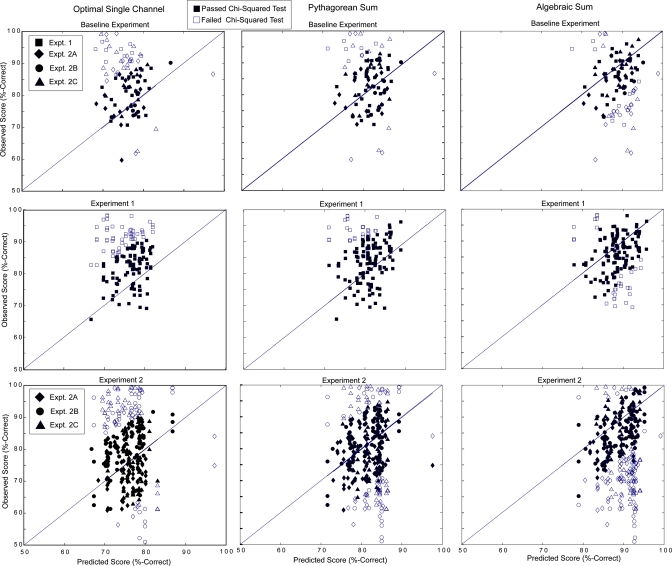
Figure 5.
Predicted vs Observed values for the three models of integration: OSCM (far left column), PSM (middle column), and ASM (right column). The first row shows all values from the baseline experiment (SOA=0 ms, phase=0°); data from each experiment are designated by a different shape (see legend). The second row shows values from all phases in experiment 1 (relative phase). The third row shows all non-zero SOA values from experiment 2; each sub-experiment delineated by shape (see legend). Open symbols indicate that the observed value failed the chi-squared test, and filled symbols indicate that the observed value passed the chi-squared test.

