Figure 2.
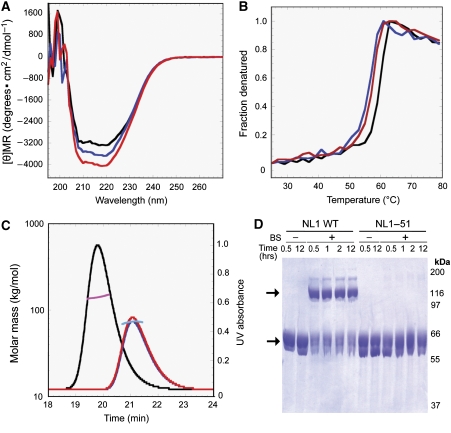
Characterization of neuroligin-1 dimerization mutants. (A) Circular dichroism spectra of wild-type (black), NL1–40 mutant (blue), or NL1–51 mutant neuroligin-1 (red), plotted as the mean residue ellipticity versus wavelength. (B) Temperature denaturation experiments of wild-type (black), NL1–40 mutant (blue), or NL1–51 mutant neuroligin-1 (red) measured by circular dichroism at 220 nm (Tm:wild type=∼59°C, 1–40=57°C; 1–51=58°C). The fractional denaturation was calculated by dividing the decrease in the CD signal at any time by the decrease in the CD signal that is achieved at maximum denaturation. (C) Combined size-exclusion chromatography and multi-angle laser light scattering of wild-type (black and magenta, respectively), NL1–40 mutant (blue and cyan, respectively), or NL1–51 mutant neuroligin-1 (red and green, respectively). Determined sizes: wild type=135.5 kDa; NL1–40=66.5 kDa; NL1–51=67.3 kDa. (D) Chemical crosslinking of wild-type and 1-51 mutant neuroligin-1, treated with 0.5 mM of bis(sulfosuccinimidyl) suberate-d0 (BS) for the indicated amounts of time. Image depicts a coomassie-stained SDS-gel; arrows point to neuroligin-1 monomers and dimers; positions of molecular weight markers are indicated on the right.

