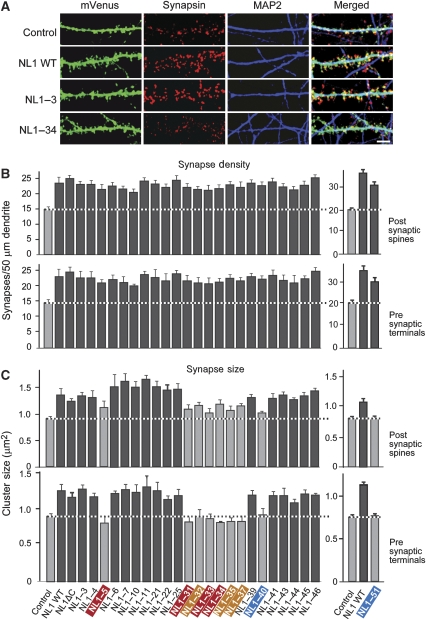
Figure 4.
Synapse induction and modification by neuroligin-1 mutants expressed in transfected neurons. (A) Representative images of neurons transfected with mVenus only (Control), or mVenus-fusion proteins of wild-type neuroligin-1 (NL1 WT) and the NL1–3 or NL1–34 mutants of neuroligin-1. Transfected neurons were visualized by triple immunofluorescence labelling for mVenus contained in the transfected neuroligins (green; left), the presynaptic marker synapsin (red; left centre), and the dendritic marker MAP2 (blue; right centre). Merged images are shown on the right (white=coincident signal; scale bar=5 μm, applies to all images). For additional representative images, see Supplementary Figure S6. (B, C) Quantitations of synapse density (B) and apparent synapse size (C) on transfected neurons expressing mVenus or the neuroligin-1 constructs listed at the bottom. Data for NL1–51 obtained in separate experiments are shown separately on the right. Synapse density was measured either as the density of light-microscopically identifiable spines (B, top) or of synapsin-positive presynaptic terminals that contact the transfected neuron (B, bottom). The apparent synapse size (C) was measured as the relative fluorescence signal intensity for either the postsynaptic neuroligin-1-fusion protein or the presynaptic synapsin staining. Data shown are means±s.e.m. (n=3–9 independent experiments; colour scheme is the same as in Figure 3). Grey bars are not statistically significantly different from the mVenus-only control; black bars are statistically significantly different at P<0.05.

