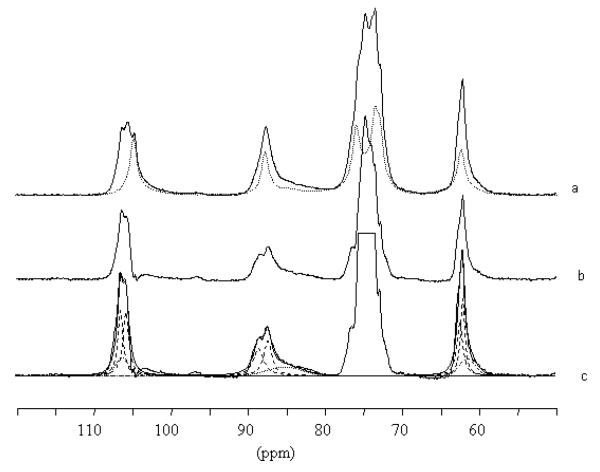
Figure 9.
13C CP/MAS spectra recorded from a) mercerized ramie treated with ammonia 1h at 180°C (solid line) and cellulose IIII (dashed line), b) spectrum obtained after subtraction of the cellulose IIII contribution from a), and c) tentative deconvolution of the preceding spectrum with crystalline (dotted lines) and amorphous (dashed lines) contributions.

