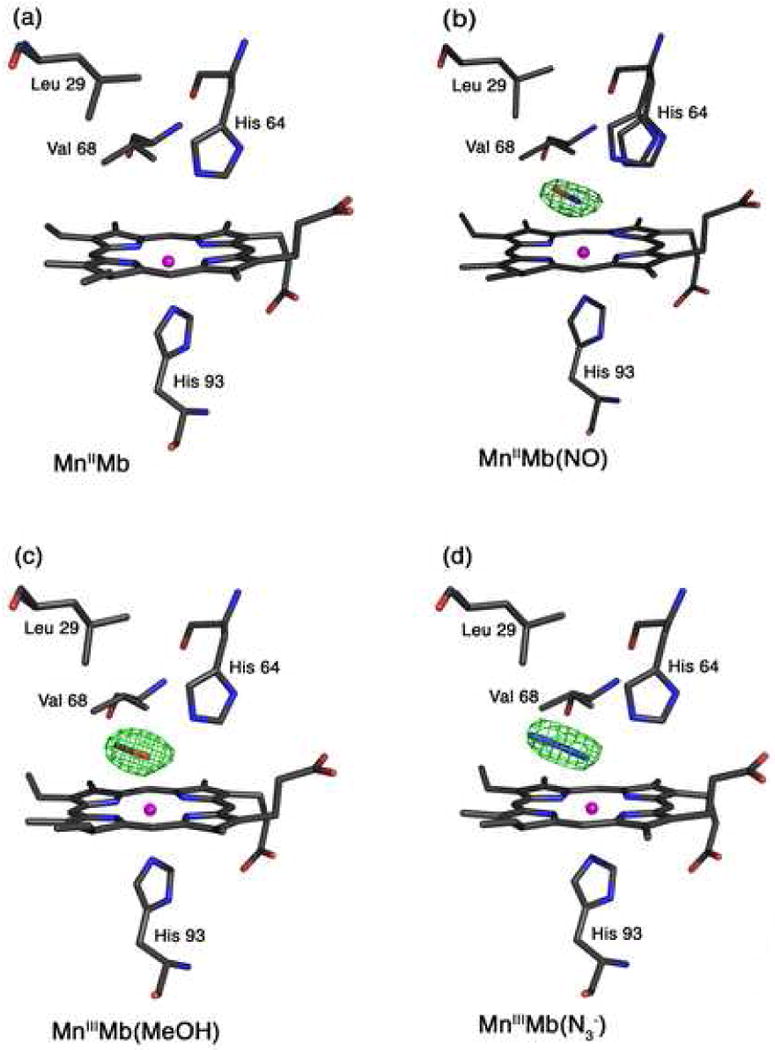
Fig. 2.

Final models and final Fo-Fc difference electron density maps showing side views of hh MnMb and CoMb derivatives. Carbon, oxygen, nitrogen, Mn, and Co atoms are colored grey, red, blue, magenta, and green, respectively. The bonds to Mn and Co are not shown for clarity. (a) The reduced MnIIMb showing the absence of electron density for a coordinated water molecule in the active site. (b) MnIIMb(NO): The difference electron density map contoured at 3σ shows an NO molecule that refined to 70% occupancy. (c) MnIIIMb(ONO): The difference electron density map is contoured at 3σ. (d) MnIIIMb(N3−): The difference electron density map is contoured at 3σ.
