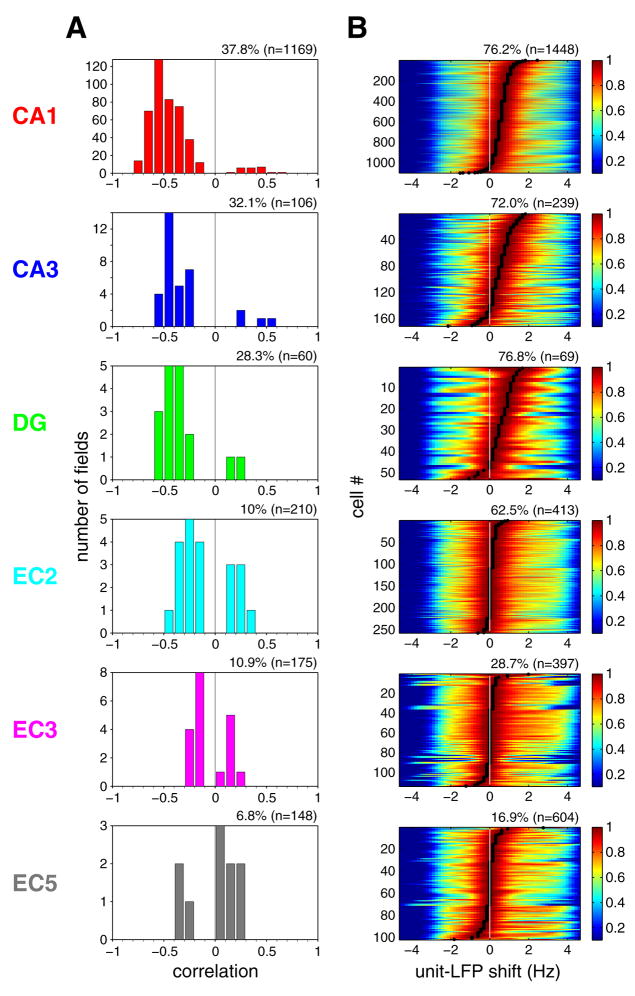
Figure 7. Phase precession of EC and hippocampal neurons.
(A) Distribution of the strength of phase precession of principal neurons in different regions/layers (Correlation between phase and position, see Supplemental Data). Only firing fields with high spatial coherence (>0.7; Hafting et al., 2008) in the linear track are included (indicated as % fields, n; total number of place fields). (B) Differences between oscillation frequencies of neuron firing and LFP theta, determined by computing the cross-correlogram of the spectra of the respective neuron and LFP (Geisler et al., 2007). Each color-coded row represents a single principal neuron, sorted by the magnitude of frequency shift (black dots) determined by the peak of cross-correlograms. Cross-correlograms were normalized by their peaks. Peak at 0 Hz indicates lack of phase precession. Only neurons with significant theta power in the linear track task are shown (expressed as % neurons, n; total number of neurons). For other behaviors, see Figures S16 and S18.

