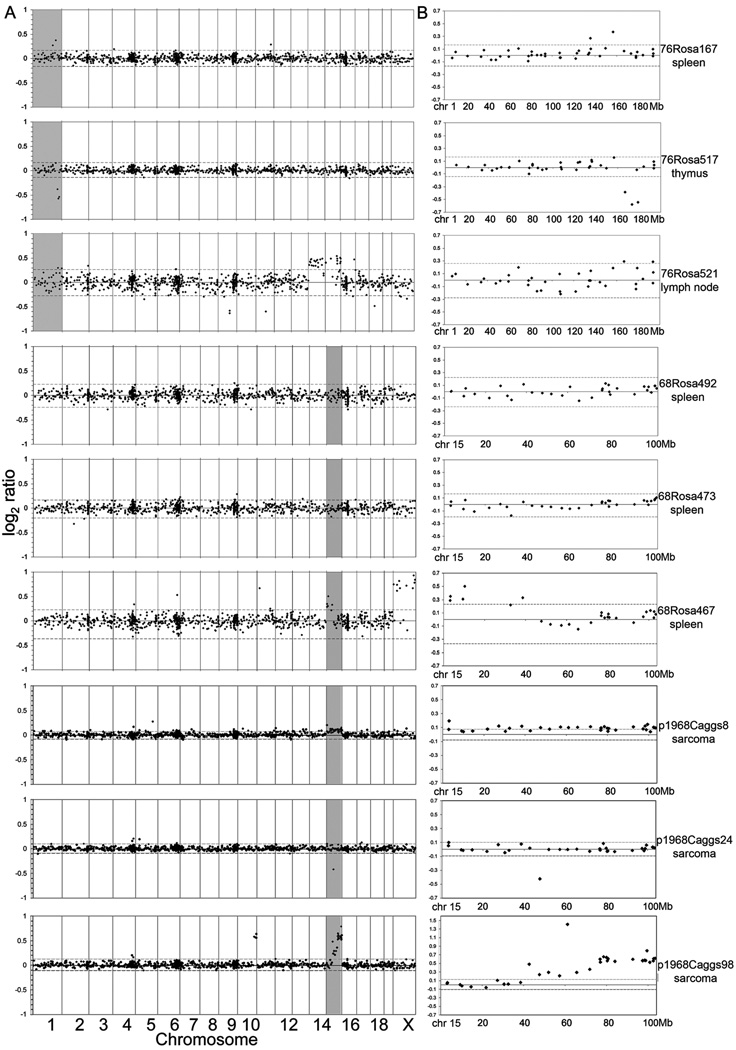
Figure 4. Rosa26-SB11;T2/onc low-copy leukemias do not show genome-wide chromosomal amplifications and deletions.
Array CGH profiles from six leukemias/lymphomas from Rosa26-SB11;T2/onc low-copy mice (76Rosa and 68Rosa) and three sarcomas from p19Arf−/−;CAGGS-SB10;T2/onc low-copy mice (p1968Caggs). Each row represents one tumor. A) Genome-wide log2 ratios. Dotted lines represent 3 standard deviations from the central mean of all clones genome wide, indicating cutoffs for gains and losses, respectively. Tumors from 76Rosa167, 76Rosa517, 68Rosa467, p1968Caggs8, p1968Caggs24 and p1968Caggs98 show localized rearrangements in the region surrounding the transposon concatomer on chromosome 1 and 15 (shaded areas). The apparent gain of the X chromosome in the tumor from 68Rosa467 is due to DNA from normal male spleen being used as reference DNA for a tumor from a female littermate mouse. B) Profiles of clones on the donor concatomer chromosome for the tumors profiled in (A).

