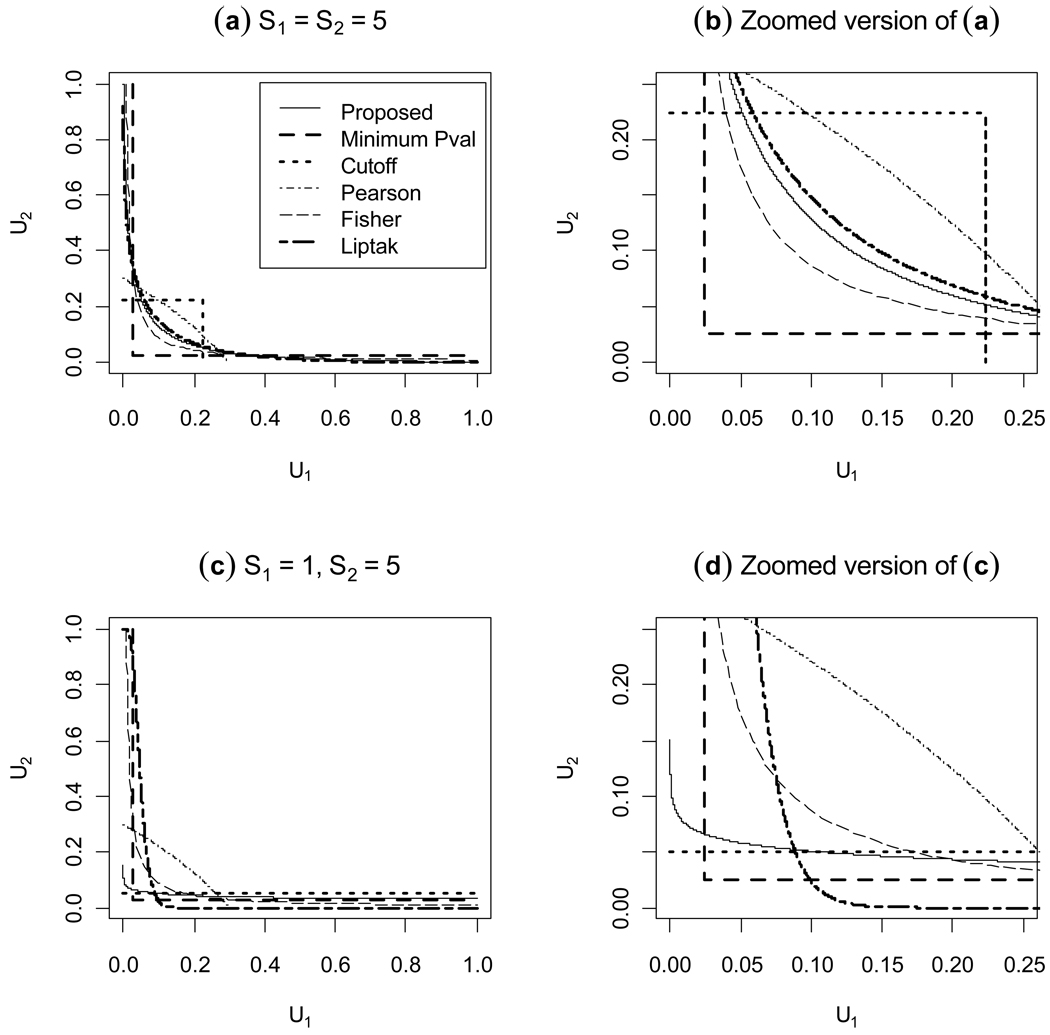
Figure 1. Rejection regions for five methods of combining two P-values at the 0.05 significance level.
Two different cases are considered: the standardized effect sizes under H1 are equal (a) and unequal (c). Because the proposed method is the most powerful, we can compare the methods that have been suggested by comparing the closeness of their rejection regions to that of our proposed method.

