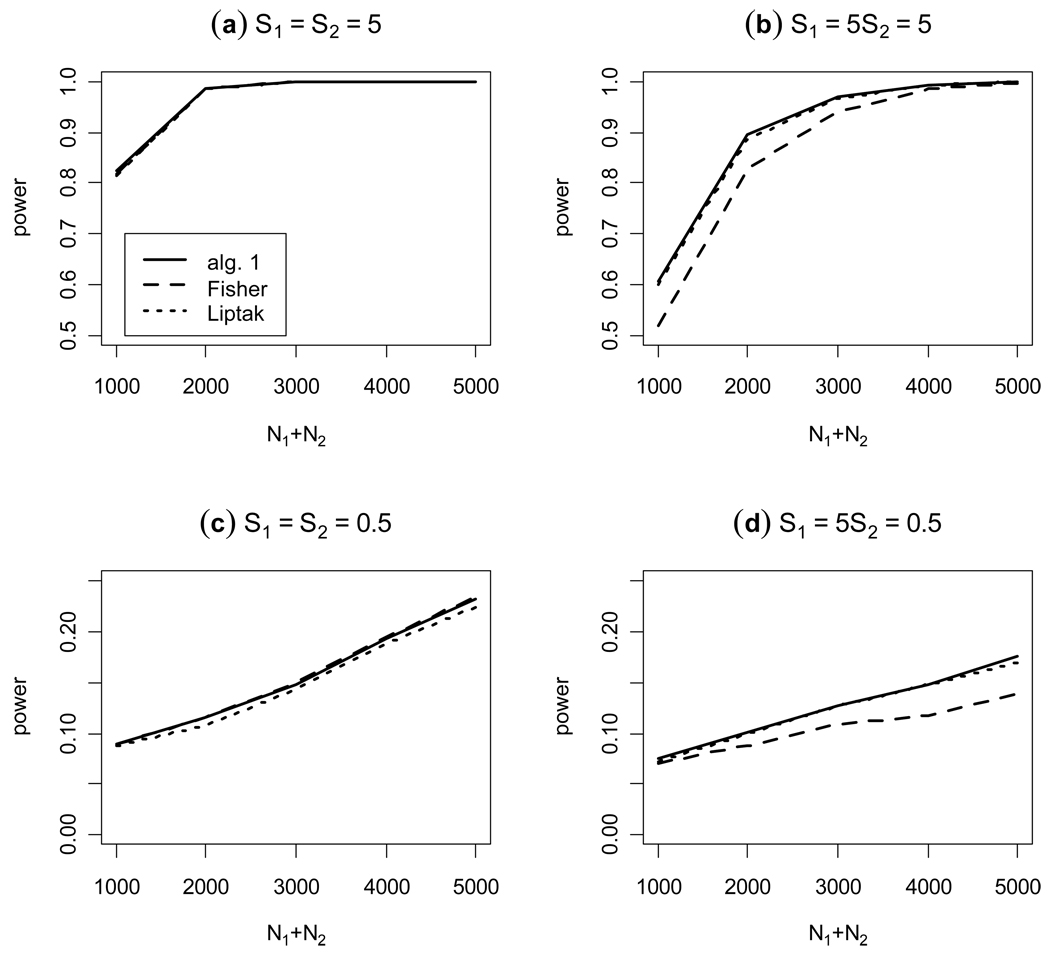
Figure 2. Empirical power as a function of the sum of the sample sizes for two p-values.
The empirical power at the 0.01 significance level is calculated, in each case for total sample sizes 1000, 2000, 3000, 4000, and 5000, obtained from a simulation of 5000 replicate samples, as a function of the sum of the sample sizes; for algorithm 1, 100,000 Monte Carlo replicates were used. Two different cases are considered: the standardized effect sizes under H1 are equal, (a) and (c), and unequal (b) and (d).

