
Figure 4.
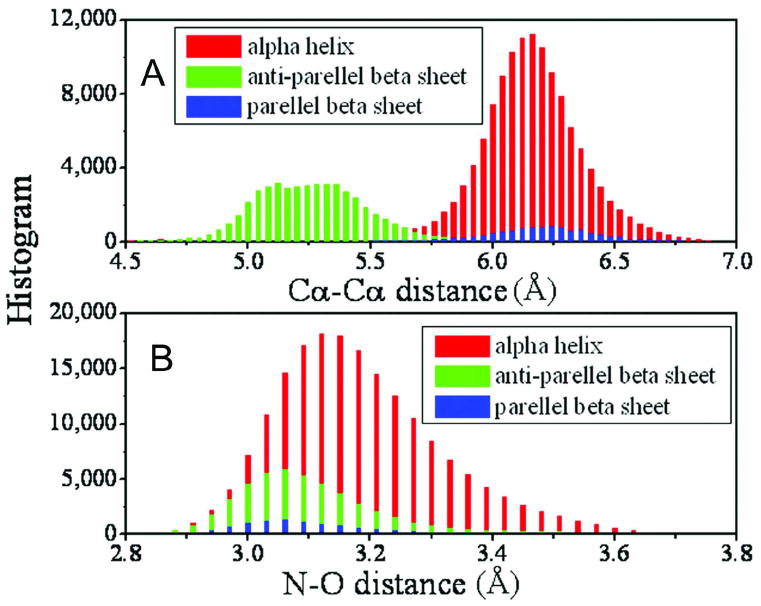
Histogram of distances between atoms in two hydrogen-bonded residues. (A) Cα-Cα distance; (B) the distance of the donor (N) and the acceptor (O) atoms. Different colors indicate the data from different secondary structures.
Official websites use .gov
A
.gov website belongs to an official
government organization in the United States.
Secure .gov websites use HTTPS
A lock (
) or https:// means you've safely
connected to the .gov website. Share sensitive
information only on official, secure websites.
Histogram of distances between atoms in two hydrogen-bonded residues. (A) Cα-Cα distance; (B) the distance of the donor (N) and the acceptor (O) atoms. Different colors indicate the data from different secondary structures.