
Figure 9.
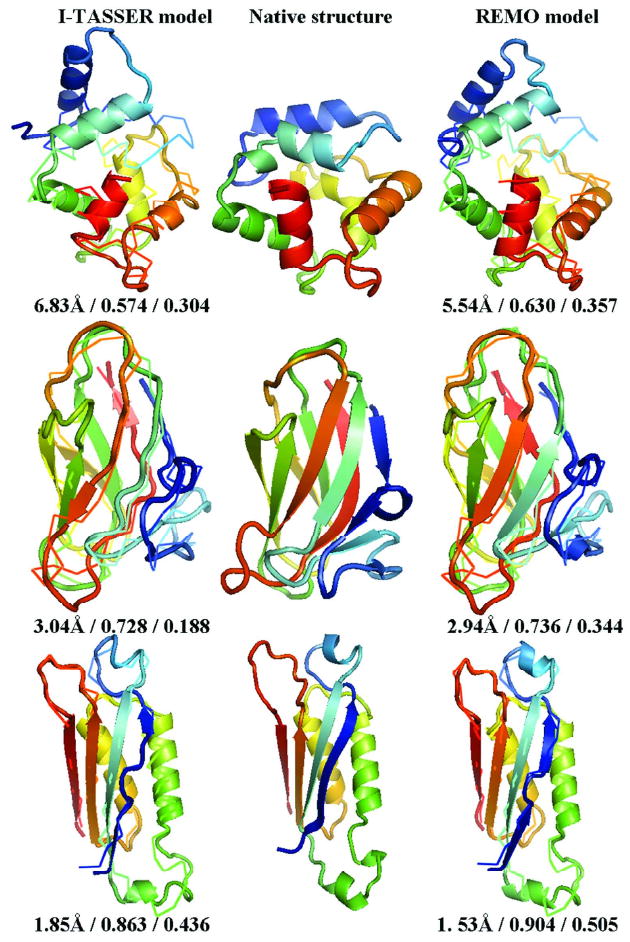
Three illustrative examples of alpha- (PDB id: 2pvb), beta- (1w0n), and alpha/beta- (1nbu) proteins. The cartoons of the native structures are listed in the middle panel. The models in Left and Right panels are built using the I-TASSER protocol and REMO, respectively. Models (in cartoons) are superimposed on the native (in backbones). Blue to red runs from N- to C-terminals. The values under each model indicate RMSD, TM-score and HB-score, respectively.