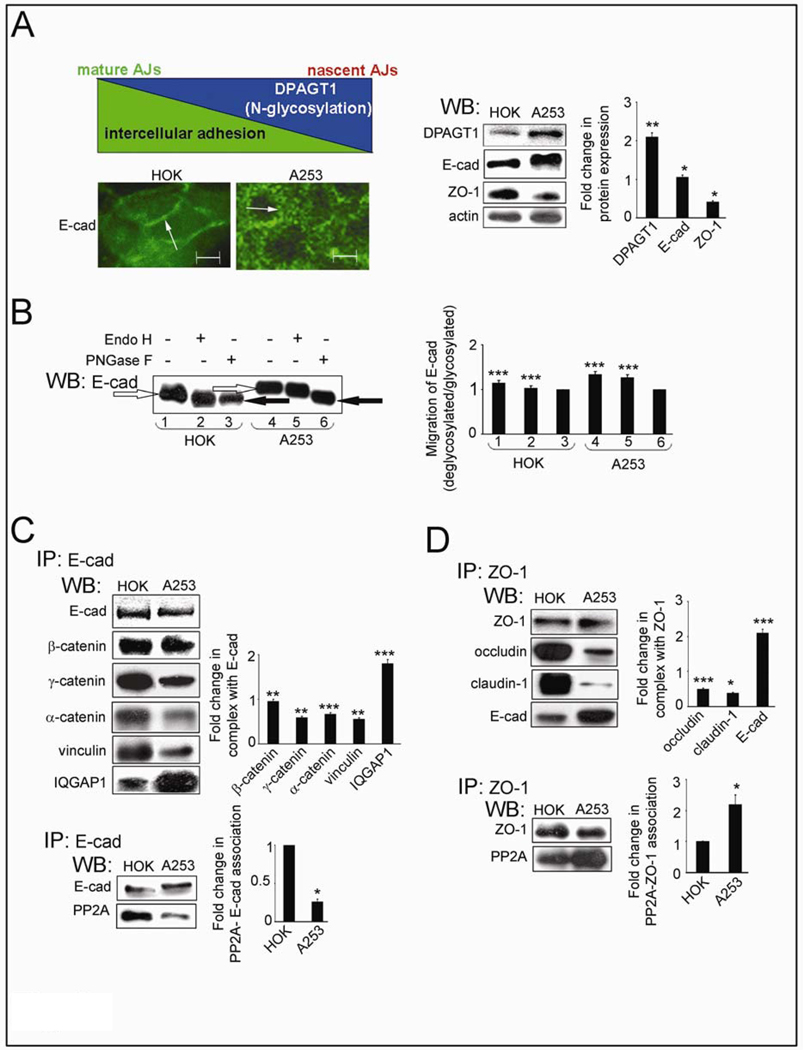
Fig. 1.
Salivary epidermoid carcinoma A253 cells produce extensively N-glycosylated E-cadherin and diminished intercellular adhesion. (A) Schematic representation of an inverse relationship between DPAGT1 expression and cell-cell adhesion was reflected in immunofluorescence localization of E-cad in dense HOK and A253 cultures (Size bars: 10 µm) and Western blot of DPAGT1, E-cadherin (E-cad) and ZO-1 expression. Bargraph, Fold changes in expression levels in A253 cells in comparison to HOK cells after normalization to actin. (B) Western blot of EndoH- or PNGaseF-treated E-cad from A253 and HOK cells. (C) Western blot of selected proteins in E-cad immunoprecipitates. Bargraph, Fold changes in expression levels in A253 cells in comparison to HOK cells after normalization to E-cad. (D) Western blot of selected proteins in ZO-1 immunoprecipitates. Bargraph, Fold change of occludin, claudin-1 and E-cadherin levels in A253 cells in comparison to HOK cells after normalization to ZO-1. All studies represent one of three independent experiments (*P<0.01; **P<0.005; ***P<0.001).

