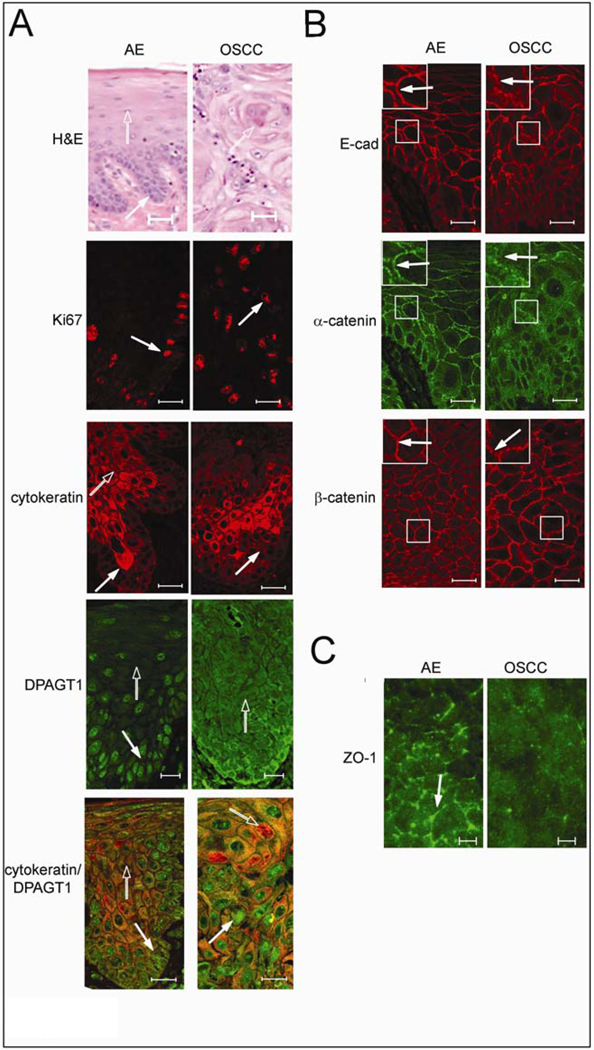
Fig. 3.
Overexpression of DPAGT1 and compromised intercellular adhesion are signatures of OSCC. (A) Comparison of H&E staining of AE and OSCC. Distinct basal cell layer (filled arrow) and characteristic stratification (unfilled arrow) were features of AE, while OSCC was marked by invasive epithelial islands displaying dyskeratosis and keratin pearls (unfilled arrow) with mild cytologic atypia and nuclear pleomorphism. Size bar: 50 µm. Immunofluorescence localization of Ki67, cytokeratin and DPAGT1. In AE, Ki67 was prominent in the basal cell layer (arrow), while in OSCC it was detected throughout the invasive epithelium (arrow). Cytokeratin was insignificant in the basal layer of AE (filled arrow) and increased in intensity with cellular maturation (unfilled arrow); in OSCC, cytokeratin staining was markedly reduced (arrow). In AE, DPAGT1 staining was most intense in the basal layer (filled arrow) being diminished in stratified regions (unfilled arrow); in OSCC, DPAGT1 expression was extensive throughout the invasive tumor islands (arrow). Merged images of cytokeratin (unfilled arrow) and DPAGT1 (filled arrow) in AE and in OSCC highlighted their inverse relationship. Size bars: 20 µm. (B) Immunofluorescence localization of E-cad and associated catenins. Sections were either doubly immunostained for E-cad and α-catenin or for β-catenin only. In AE, E-cad and α-catenin were at cell-cell borders (arrows, insets) while in OSCC, E-cad displayed more punctate staining and α-catenin was diffuse (arrows, insets). Immunostaining of β-catenin did not appear greatly altered between AE and OSCC. Size bar: 20 µm. (C) Immunolocalization of ZO-1. ZO-1 was detected at cell-cell borders in AE (arrow), but was significantly diminished at these sites in OSCC. Size bars: 5 µm. Results represent one of three independent experiments.

