Table 3.
Screening assay of Compound 5 and similarity search matches. Comparison of LPA3 inhibition by analog compounds. Compounds were tested using 10 μM against 200 nM LPA. Refer to Figure 3 for scaffold structures.
| Compound | Hit2lead ID | Scaffold | R1 | R2 | % inhibition at 10μM |
|---|---|---|---|---|---|
| 5 | 5747876 | I | 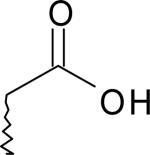 |
10 | |
| 6 | 6582859 | I |  |
agonist | |
| 7 | 7886891 | I |  |
18 | |
| 8 | 5759401 | I | 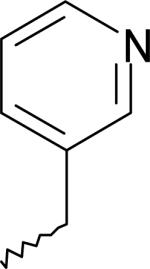 |
38 | |
| 9 | 5233136 | I | 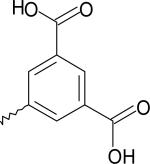 |
43 | |
| 10 | 5751335 | I | 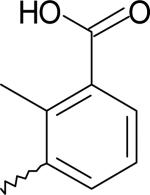 |
42 | |
| 11 | 5770242 | II | 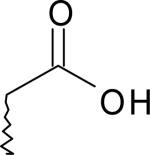 |
NO2 | NE |
| 12 | 7724589 | II | 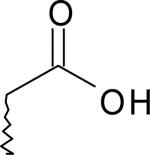 |
CH3 | 62 |
| 13 | 5160780 | II | 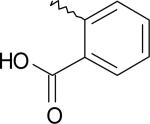 |
NO2 | 38 |
| 14 | 7334533 | II |  |
CH3 | NE |
| 15 | 5750136 | III | 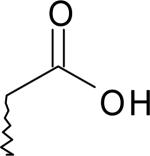 |
Agonist | |
| 16 | 7901752 | III |  |
10 | |
| 17 | 5128706 | IV | 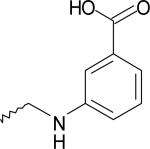 |
NE | |
| 18 | 7890363 | IV |  |
Agonist | |
| 19 | 5233285 | IV |  |
18 | |
| 20 | 5765834 | V | 82 |
