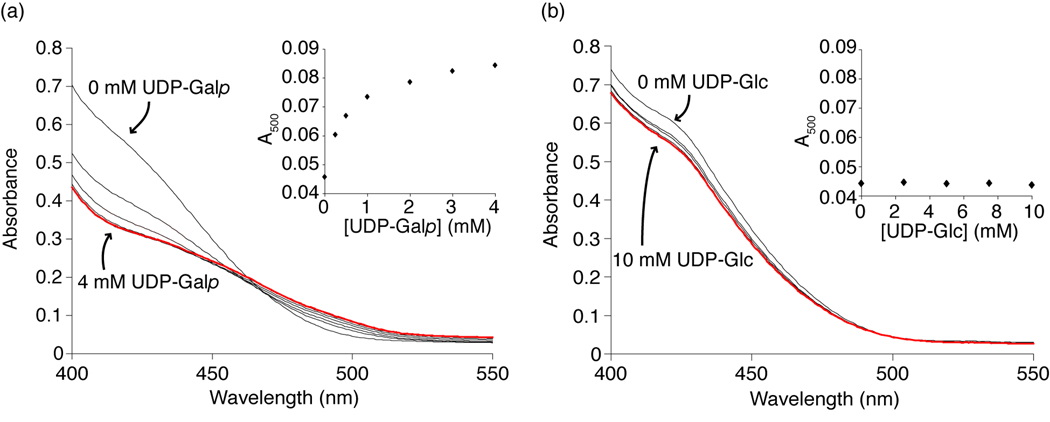
Figure 2.
Spectrophotometric studies probing for a flavin-derived iminium ion. Spectra were recorded as 0–4 mM UDP-Galp (a) or 0–10 mM UDP-Glc (b) was titrated into a sample of reduced UGM. The red line represents the absorbance spectrum at the highest concentration of ligand. Inset shows absorbance at 500 nm, the wavelength of iminium ion absorbance. A change is detected for UDP-Galp but not UDP-Glc. Results in (a) have been published previously25 and are shown for comparison.

