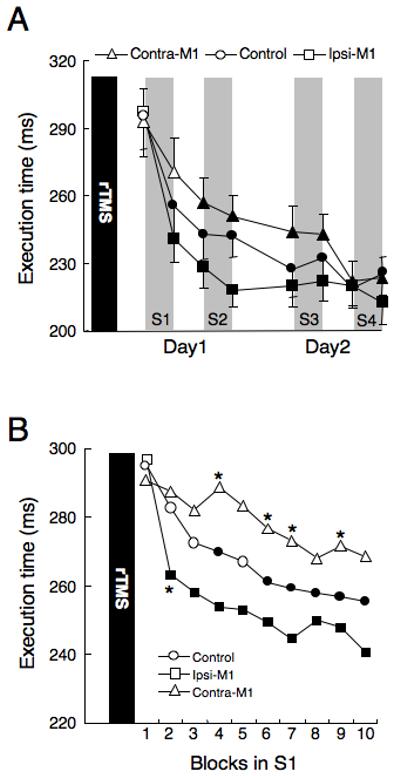
Figure 2.

A) Changes in execution time. Each plot represents mean execution time in one practice block. Data from the initial block on Day-1 (baseline), the first block on Day-2, and the last one in each practice session are plotted. Execution time improved with practice sessions. In the group with rTMS to the ipsilateral M1, the execution time at the end of Day-1 (after S2) was significantly shorter than in the other two groups (*, p < 0.05). The group with rTMS of the contralateral M1 improved their execution times slower than the other two groups, but not significantly. Filled symbols indicate significantly shorter values than baseline (p < 0.05). Error bars represent standard error. B) Changes of execution time during the ten blocks of the first session (S1). Subjects with rTMS to the ipsilateral M1 improved their execution times faster than the other two groups. Conversely, subjects with rTMS to the contralateral M1 improved their execution times slower than the other two groups. Asterisks show the values that are significantly different from those of controls, indicating shorter or longer values. Filled symbols represent significantly shorter values than baseline, indicating significantly improved performance.
