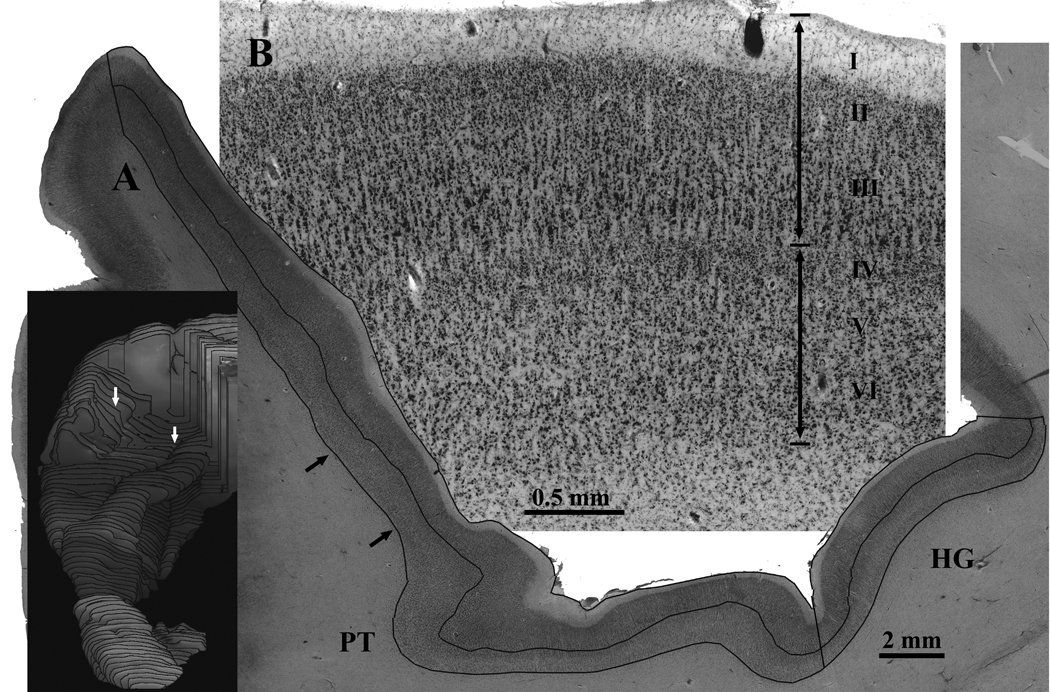
Figure 4.
An example is shown of the methods used to measure the fractional volumes of the upper and lower layers. A) High resolution video montages were made of every 0.96 mm spaced Nissl stained section through Heschl’s gyrus (HG) and the planum temporale (PT). On each montage, interactive software was used to outline the borders of the pial surface, the border between layers 3 and 4, and the border between cortex and white matter. The upper layer volume fraction for each region of interest (PT or HG) was the sum of the areas of the upper layers divided by the total sum of the upper and lower areas. Small black arrows show the location of the cortex displayed in B. The inset shows the location of the section displayed in A (white arrows). B) A piece of the section from A is shown at higher magnification. The upper boundary of layer IV was used to subdivide the upper layers (I–III) from lower layers (IV–VI).

