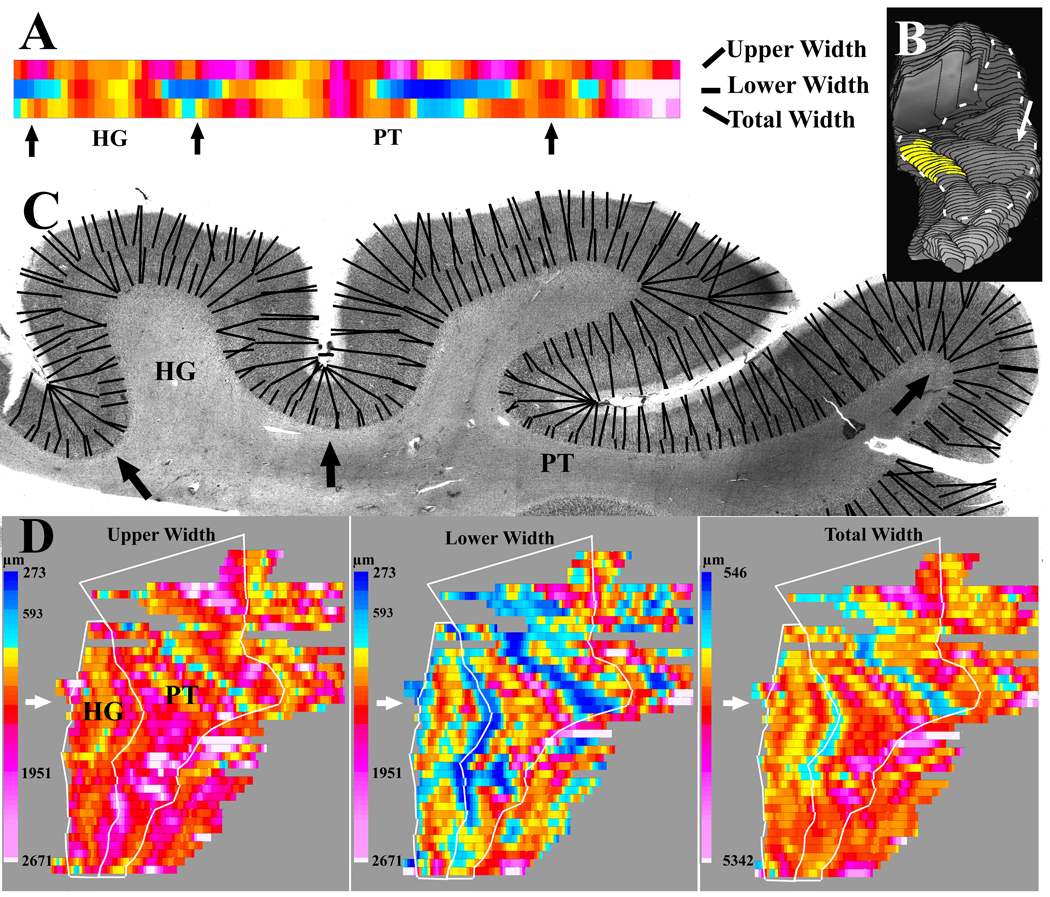
Figure 6.
An example is shown of the methods used to measure the widths of the upper and lower layers. A) The output from width measurements of individual sections was displayed as 3 linear arrays of colored rectangles. The array length corresponded to the length of layer 4, and each rectangle corresponded to an average of the 2 nearest width measurements. Arrows show the corresponding location on the histological section in B. The color scales are shown in C. B) The source of the histological section from A (white arrow) is shown in a reconstruction of the PT in this sample. For purposes of orientation, the location of the cytoarchitectonically identified primary auditory cortex on HG is highlighted in yellow. C) Widths were measured between the same laminar borders used for fractional volume measurements. Evenly spaced points along each border were selected, and the shortest line distance to the nearest adjacent border (black lines) was determined. The dashed white line outlines the extent of the PT and HG used for width measurements. D) For each hemisphere, 3 sequential flat maps are produced showing the upper widths, lower widths, and total widths. Sequential output from adjacent sections are aligned to make a flat map of the entire HG and PT. On each map, the white arrow shows the output from the section displayed in A and B. The white lines show the borders of the PT and HG that were outlined to summarize the average width of these regions of interest. The thinning at the fundus of sulci is seen most clearly in the map of the lower layer widths.

