
Figure 2.
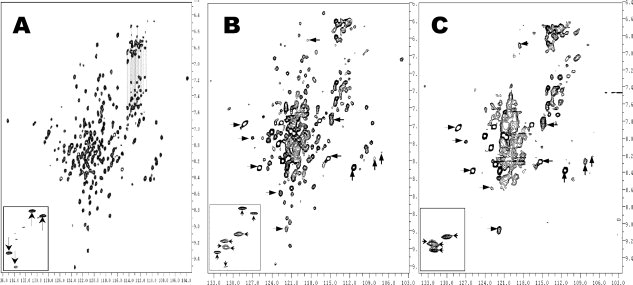
[15N, H] TROSY-HSQC spectra of Lp1AI (Panel A), rHDL sample before the first ultracentrifugation (Panel B) and rHDL sample after the first ultracentrifugation (Panel C). These spectra were recorded on a Varian INOVA 500 MHz spectrometer with a triple-resonance room temperature probe. The insets of different panels show the crosspeaks of the Trp sidechain Hɛ1/Nɛ1 atoms. The NMR samples are in 50 mM phosphate buffer at pH7.0, with 50 mM NaCl, 5 mM EDTA, 0.5 mM NaN3, and 0.05 mM DSS.