
Figure 4.
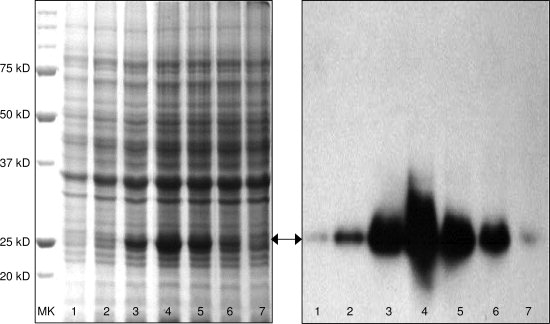
Left Panel: An SDS-PAGE showing autoinduction time course of triple-labeled human apoAI expression in D2O at room temperature. The expected apoAI band is indicated by an arrow. Lane 1:24 h, Lane 2:28 h, Lane 3:32 h, Lane 4:36 h, Lane 5:40 h, Lane 6:44 h, and Lane 7:54 h. Panel B: Western blot of the same time course using an anti-human apoAI monoclonal antibody, 5F6.