
Figure 6.
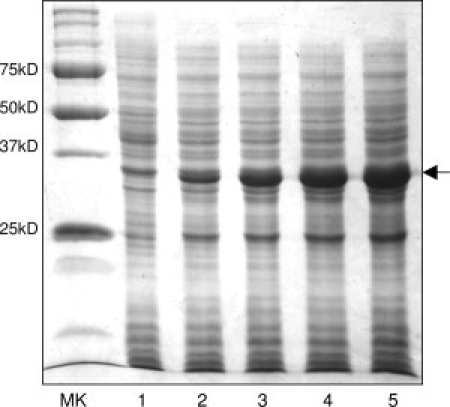
A 12% SDS-PAGE of glucose optimization of human apoE expression in D2O at 20°C using high-cell-density IPTG-induction bacterial expression: Uninduced (Lane 1), with 0.4% (Lane 2), 0.6% (Lane 3), 0.8% (Lane 4), and 1.0% glucose (Lane 5). Molecular weight marker is shown in left lane. Small-scale time course experiments with different glucose concentrations were also carried out to find the optimum protein expression time after induction of the culture.