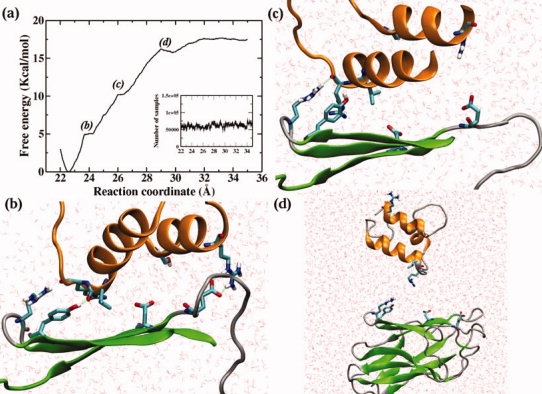
Figure 5.

(a) Free energy profile for the dissociation of cohesin and dockerin domains. The sampling distribution is included in the inset. (b) Snapshot of the cohesin-dockerin complex at ξ = 24 Å; (c) Snapshot at ξ = 27 Å; and (d) Snapshot of cohesin-dockerin complex in the dissociated state, that is, ξ > 30 Å. The two α-helices, β-strands 3, 5, 6, and loop/turn regions are represented in cartoon mode, colored orange, green, and gray, respectively. The rest of the protein structure was omitted for clarity.
