Figure 2.

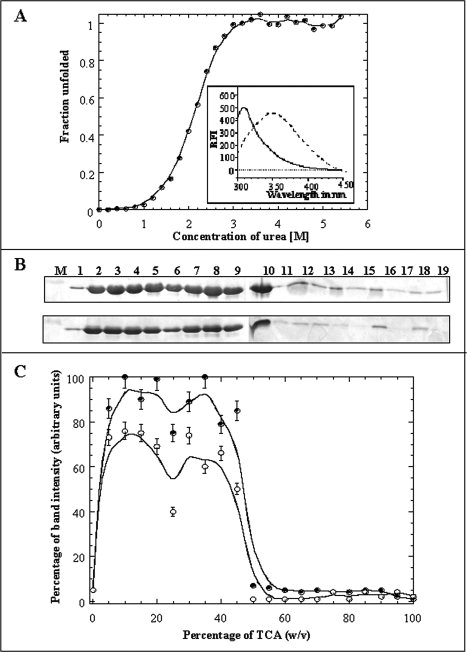
Panel (A) Fraction of unfolded species of the aFGF formed at various concentrations of urea. The unfolding profile was monitored by the changes in the emission intensity at 350 nm. The Cm value for the urea-induced unfolding of the aFGF, estimated from the fluorescence experiments, is 2.1 ± 0.05M. The inset shows the emission spectra of the aFGF in native (continuous line) and denatured (dotted line) in 6M urea. Panel (B) SDS-PAGE analysis of the TCA-induced precipitation of aFGF in 0M urea and in presence of 6M urea. Lane: M, Marker; 1, 0% w/v TCA; 2, 5% w/v TCA; 3, 10% w/v TCA; 4, 15% w/v TCA; 5, 20% w/v TCA; 6, 25% w/v TCA; 7, 30% w/v TCA; 8, 35% w/v TCA; 9, 40% w/v TCA; 10, 45% w/v TCA; 11, 50% w/v TCA; 12, 55% w/v TCA; 13, 60% w/v TCA; 14, 65% w/v TCA; 15, 70% w/v TCA; 16, 75% w/v TCA; 17, 80% w/v TCA; 18, 85% w/v TCA; and 19, 90% w/v TCA, respectively. Panel (C) The percentage of protein precipitated in the presence of different concentrations of urea, 0M urea- closed circle, 6M urea- open circle, was measured based on the intensity (after Coomassie blue staining) of the ∼16 kDa protein band (on the polyacrylamide gel).
