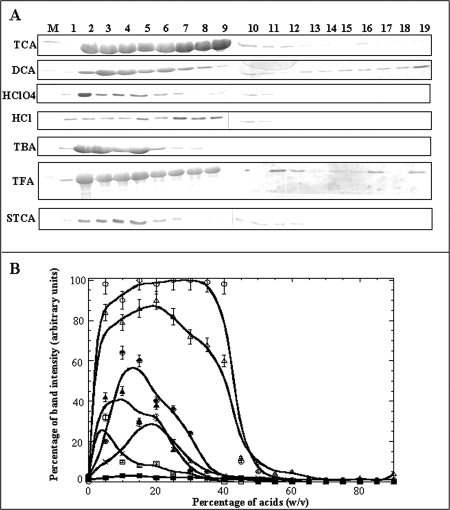
Figure 4.

Panel (A) SDS-PAGE analysis of the precipitate of aFGF formed in different acids. Lane: M, Marker; 1, 0% w/v; 2, 5% w/v; 3, 10% w/v; 4, 15% w/v; 5, 20% w/v; 6, 25% w/v; 7, 30% w/v; 8, 35% w/v; 9, 40% w/v; 10, 45% w/v; 11, 50% w/v; 12, 55% w/v; 13, 60% w/v; 14, 65% w/v; 15, 70% w/v; 16, 75% w/v; 17, 80% w/v; 18, 85% w/v; and 19, 90% w/v. Panel (B) The percentage of protein precipitated in TCA (open circle), dichloroacetic acid (filled circle), perchloric acid (open square), hydrochloric acid (filled square), tribromoacetic acid (filled triangle), trifluoroacetic acid (open triangle), and sodium trichloroacetate (X), was measured based on the intensity (of the Coomassie blue stained) of the ∼16 kDa protein band (on the polyacrylamide gel).
