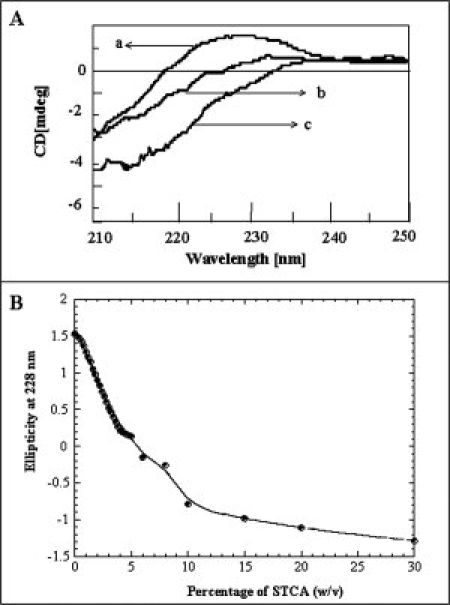
Figure 5.

STCA-induced secondary structural changes in aFGF monitored by far-UV CD. Panel (A) shows the far- UV CD spectra of aFGF at different concentrations of STCA. (a) 0% w/v STCA, (b) 5% w/v STCA, and (c) 50% w/v STCA. Panel (B) Plot of ellipticity (at 228 nm) versus concentration of STCA.
