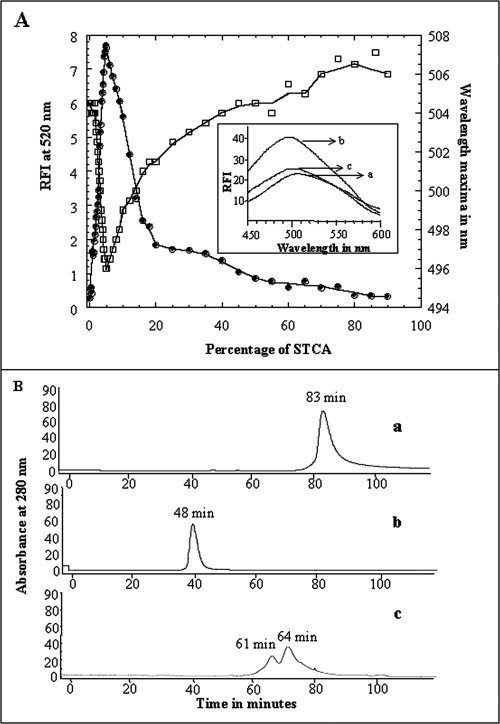
Figure 6.

Panel (A) Binding of ANS to aFGF at various concentrations of STCA. Changes in the emission intensity at 520 nm and the shift in wavelength emission maximum on ANS are represented in closed and open circles, respectively. The inset figure shows the emission spectra of the aFGF at different concentrations of STCA. (a) 0% w/v STCA, (b) 5% w/v STCA, and (c) 50% w/v STCA. Panel (B) Size exclusion chromatography of aFGF, (a) in the native conformation (0% STCA), (b) in the denatured state(s) in 50% w/v STCA, and (c) in the “MG”-like state in 5% w/v STCA. Elution of the protein was monitored by its absorbance at 280 nm. The flow rate of elution was 1 mL/min. The concentration of the protein used in the experiment was ∼0.5 mg/mL. Elution of the protein (at 25°C) was carried out using 10 mM phosphate buffer containing 100 mM NaCl.
