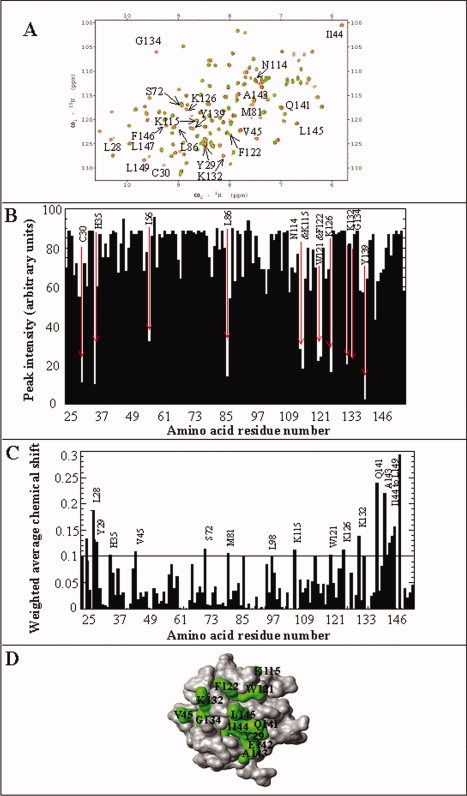
Figure 8.

Panel (A) Overlap of 1H-15N HSQC spectrum of aFGF in absence (red) and presence of 5% w/v STCA (green). Panel (B) 1H-15N chemical shift perturbation of residues in aFGF in the presence of 5% w/v STCA. The amino acid residues in aFGF that showed significant chemical shift perturbation and involved in STCA binding are indicated by their single letter codes. Panel (C) Crosspeak intensity of residues in the 1H-15N HSQC spectrum of aFGF obtained in the presence of 5% w/v STCA. The crosspeaks that show significant decrease in their intensities represent the STCA binding sites. Panel (D) MolMol representation of the structure of aFGF (grey). Residues that show significant decrease in intensity and chemical shift perturbation in presence of 5% w/v STCA are depicted in green.
