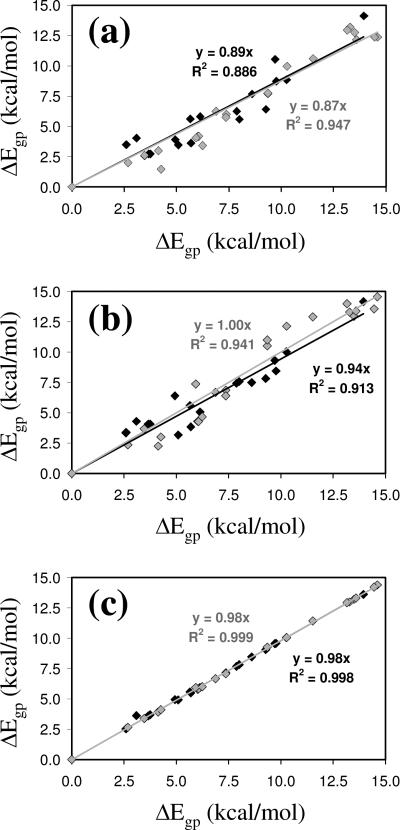
Figure 5.
Graphical representation of ΔEgp calculated at the B3LYP/6-31+G(d,p) level vs. ΔEgp predicted at the (a) MP2/6-31+G(d,p), (b) HF/6-31+G(d,p) and (c) B3LYP/6-311++G(d,p) levels for Ac-c-l-c6Phe-NHMe (black diamonds) and Ac-t-l-c6Phe-NHMe (grey diamonds). The regressions (y= c·x) and correlation coefficients (R2) are displayed for each compound.

