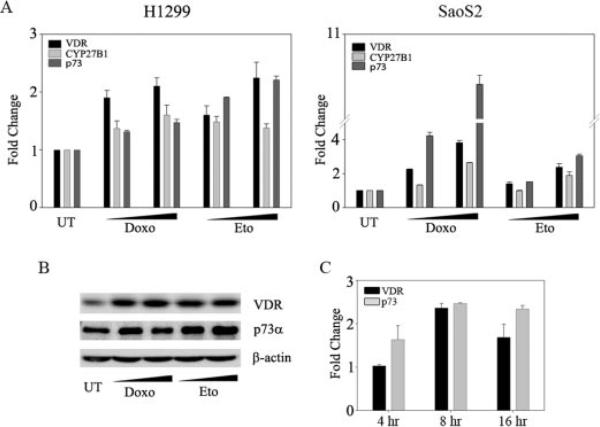
FIGURE 3. DNA damage-induced expression of VDR is independent of p53 and is coupled to p73 expression.
H1299 and SaoS2 cells were either untreated (UT) or treated with doxorubicin (Doxo; 0.2 and 0.4 μm) or etoposide (Eto; 6 and 8 μm for H1299 and 2 and 4 μm for SaoS2). A, 24 h post-treatment, cells were harvested, and TaqMan real time PCR was performed to determine the transient expression levels of VDR, CYP27B1, and p73. The y axis indicates change in mRNA levels compared with untreated cells. B, 24 h post-treatment, H1299 cells were harvested and subjected to Western blot analysis to detect the protein levels of VDR and p73 using gene-specific antibodies, respectively. For the detection of p73 protein levels, whole cell lysates were first immunoprecipitated with monoclonal anti-p73 antibody and immunoblotted with polyclonal anti-p73 antibody. C, H1299 cells were treated with 8 μm etoposide, and total RNA was extracted at indicated time points post-treatment. TaqMan-based reverse transcription-PCR was performed to detect the transcript levels of p73 and VDR. The y axis represents the -fold change in VDR and p73 transcript levels relative to untreated cells at the respective time points.

