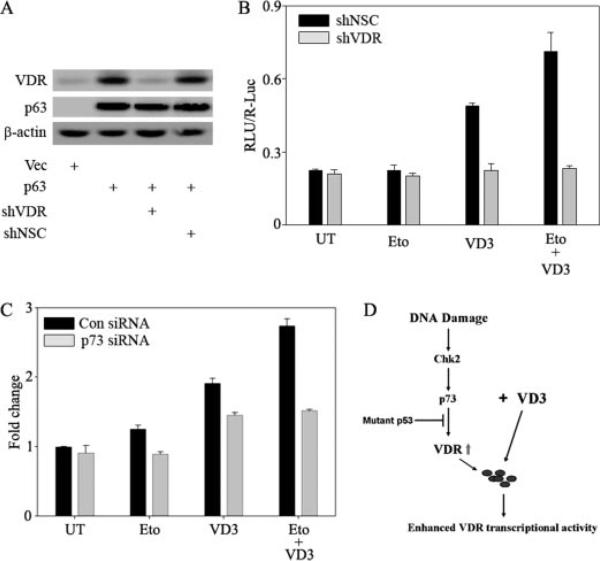
FIGURE 6. DNA damage-induced VDR expression sensitizes the cells to vitamin D treatment.
A, H1299 cells were transfected with control vector or p63 alone or along with shVDR or shNSC as indicated. After 24 h of post-transfection, cells were harvested for whole cell lysates and subjected to immunoblot analysis to detect VDR, p63, and β-actin using gene-specific antibodies. B, H1299 cells were plated on 12-well plates and co-transfected with VDRE-Luc reporter along with either shNSC or shVDR as indicated. The next day, cells were either treated with 8 μm etoposide (Eto) or left untreated (UT) as indicated. 12 h of post-treatment, cells were treated with 100 nm VD3 as indicated. At 24 h after VD3 treatment, cells were harvested in PLB buffer and subjected to a dual luciferase assay. The y axis represents RLU/R-Luc relative luciferase units normalized for transfection efficiency. C, H1299 cells were transfected with control siRNA or p73 siRNA as described earlier. Immediately after two rounds of transfections with siRNA, cells were replated onto 24-well plates and transfected with VDRE-Luc reporter. The next day, cells were either treated with 8 μm etoposide or left untreated, as indicated. Subsequently, cells were treated with 100 nm VD3 as indicated. At 24 h post-VD3 treatment, cells were harvested in PLB buffer and subjected to a dual luciferase assay as mentioned earlier. D, model illustrating that DNA damage induces p73, causing downstream VDR induction, which subsequently sensitizes cells to VD3 treatment.

