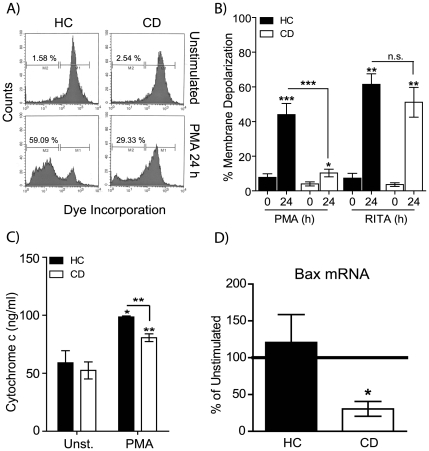
Figure 2. Mitochondrial membrane depolarization, cytochrome c and BAX expression are abnormal in CD macrophages after PMA activation.
Macrophages were stimulated with 1 µg/ml PMA for 24 h and the effects on mitochondrial membrane potential, cytochrome c and BAX expression determined. A Representative histograms of macrophage population for HC unstimulated (upper left panel), HC PMA 24 h (lower left), CD unstimulated (upper right) and CD PMA 24 h (lower right) are shown. Gated populations show cells with an intact mitochondrial membranes (M1) and cells which have lost mitochondrial membrane integrity (M2). B Proportion of macrophages with mitochondrial membrane depolarization are shown as mean percentage ± SEM after either PMA (HC n = 9, CD n = 10) or RITA (HC n = 5, CD n = 5) stimulation. C Intracellular cytochrome C levels in macrophages stimulated with 1 µg/ml PMA for 24 h were measured by ELISA. Cytochrome C production (ng/ml) at 24 h is shown for HC (n = 4, black bars) and CD (n = 8, open bars). D Macrophages were stimulated with 1 µg/ml PMA for 4 h followed by total RNA isolation. Bax mRNA levels were determined by qPCR and expressed as the change in expression compared to unstimulated cells. Statistical analysis: Paired or unpaired t-test. Symbols: p<0.05 (*), p<0.01 (**), p<0.001 (***).

