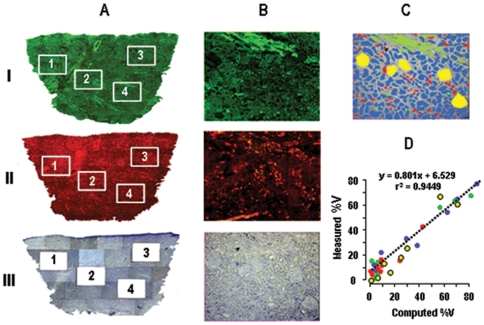
Figure 2. Validation of TCA by histo-morphometric analysis of kidney tissue composition.
A. Overview of three kidney serial sections stained with anti-uromodulin antibody (I), anti-AQP2 antibody (II), and toluidine blue (III, micrographs after LCM). The zones (1 to 4) used for analysis are delineated. B. Higher magnification images of zones 4 (before LCM for section III). C. Image analysis of zone 4 allowing the construction of the color-coded image (G, yellow; PCTs, blue; cTAL, green; CCDs, red; grey, remaining tissue) used for determination of the surface area of the different compartments. D. Relationship between TCA-computed and measured fractional volumes of the 4 compartments in 8 samples analyzed as described in C (same color code as in C). The slope of the regression line was not statistically different from 1 (t test).

