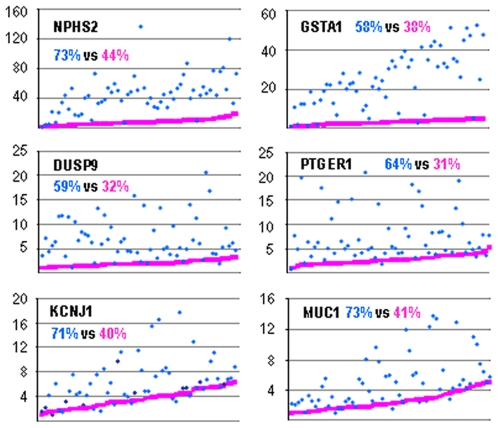
Figure 4. Data standardization.
Expression of NPHS2 (podocin), GSTA1 (Glutathione S-transferase α1), DUSP9 (Dual-specificity phosphatase 9), PTGER1 (Prostaglandin E receptor 1), KCNJ1 (Renal outer medullary potassium channel, ROMK1) and MUC1 (Mucin 1) in 60 normal samples was standardized either by the reference gene RPLP1 (blue points) or by SF (pink points). Similar results were obtained when using RPL19 or PPIA as reference genes. Data are expressed as fold of the lowest value, and samples are ranged according to increasing SF-standardized values. Values in the graphs are the variances for RPL1-normalized (blue) and SF-normalized data (pink).

