
Figure 1.
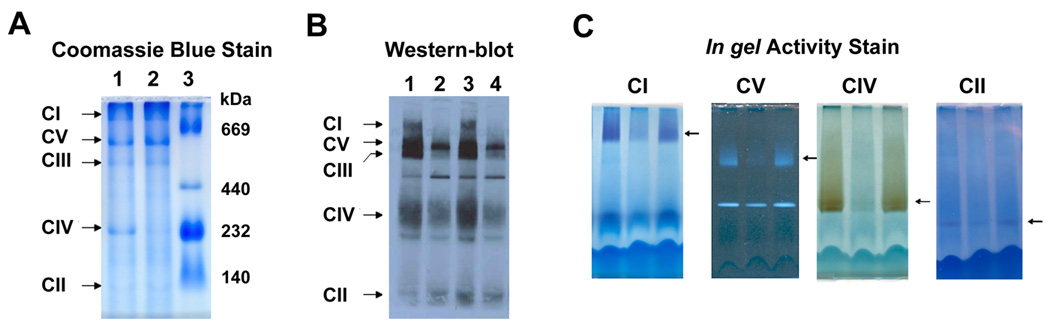
Blue Native Gel electrophoresis. (A) Mouse muscle mitochondria separated by BNG and stained with Coomassie blue to visualize respiratory complexes, lane 1: control mouse, lane 2: COX deficient mouse, lane 3: Native High Molecular weight marker (GE). (B) BN-western blot using Invitrogen 4–16 gradient gel and Antibody Cocktail from Mitosciences. The samples are mitochondrial fractions from mouse fibroblasts. Lanes 1 and 3 control cells and lanes 2 and 4 fibroblasts deficient in CI and CIII. (C) In gel activity stain of respiratory complexes of mouse liver mitochondria. In CV activity stain the F1 (lower band) dissociates from the fully assembled complex (arrow) and retains ATP hydrolysis activity.