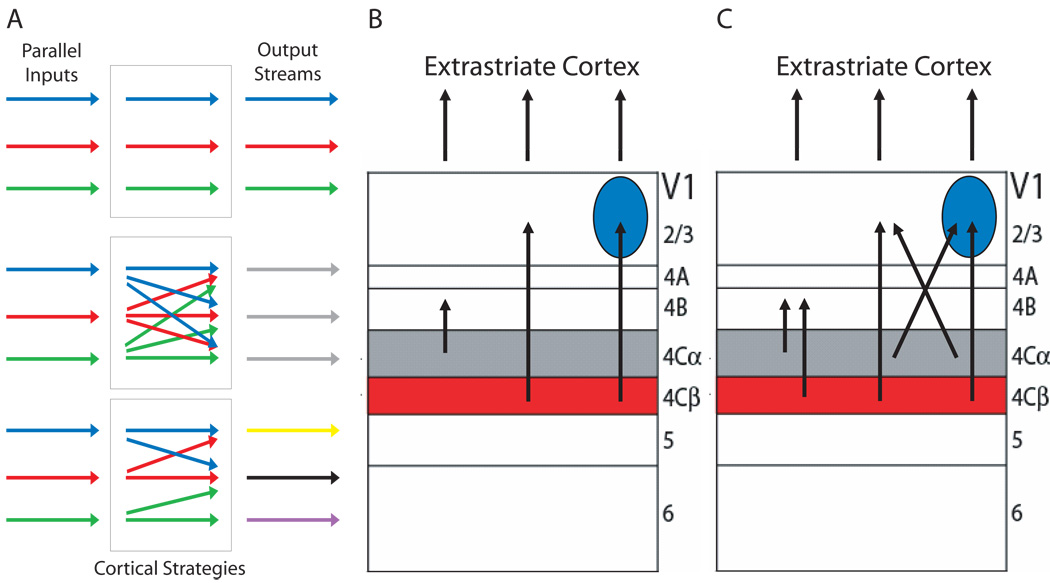
Figure 3. Cortical processing strategies.
(A) Multiple strategies might be used by a visual cortical area (rectangles) in order to transform parallel inputs (arrows to the left of rectangles) into multiple outputs (arrows to the right of rectangles). One possibility (top) is that segregation of inputs is maintained (arrows within top rectangle) and passed directly on to the outputs. A second possibility (middle) is that these inputs mix indiscriminately (arrows within middle rectangle) and bear no systematic relationship to the outputs. A third possibility (bottom) is that the parallel inputs converge in an organized and specific way (arrows within bottom rectangle) so as to form the basis for specialized outputs. (B) Early models of V1 proposed that M and P pathway inputs remained segregated within V1 as they passed through layers 4B and 2/3 respectively and on to extrastriate cortex. (C) Recent studies have provided evidence for extensive intermixing and convergence of M, P and K pathway inputs, suggesting that V1 outputs bear little or no systematic relationship to its parallel inputs. Cytochrome oxidase-expressing blobs are shown as blue circles.

