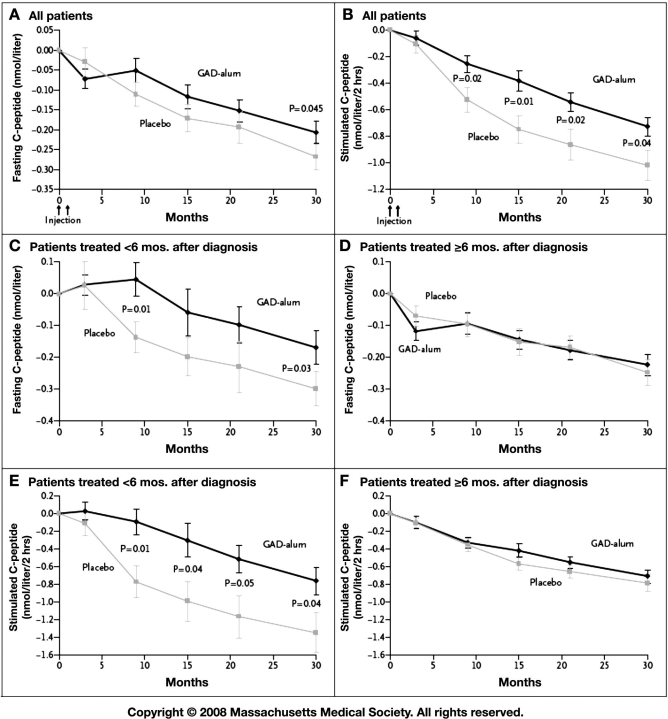
Figure 1.
Mean changes from baseline levels of fasting and stimulated C-peptide, according to treatment group and time of treatment relative to diagnosis. Mean changes from baseline in fasting (A) and stimulated (B) C-peptide levels are given for all patients included in intention-to-treat analyses in the group receiving the recombinant human 65-kDa isoform of glutamic acid decarboxylase in a standard vaccine formulation with alum (GAD–alum, 35 patients) and in the group receiving placebo (34 patients). Mean changes from baseline in fasting (C) and stimulated (E) C-peptide levels are also shown for patients treated less than 6 months after receiving the diagnosis of diabetes (11 patients in the GAD–alum group and 14 patients in the placebo group). Finally, mean changes from baseline in fasting (D) and stimulated (F) C-peptide levels are shown for those treated 6 months or more after diagnosis (24 patients in the GAD–alum group and 20 patients in the placebo group). Stimulated C-peptide level was measured on the basis of areas under the curve in response to the mixed-meal tolerance test. I bars indicate standard errors. To convert values for C-peptide to nanograms per milliliter, divide by 0.33. Reproduced from Reference 1 with permission from New England Journal of Medicine.

