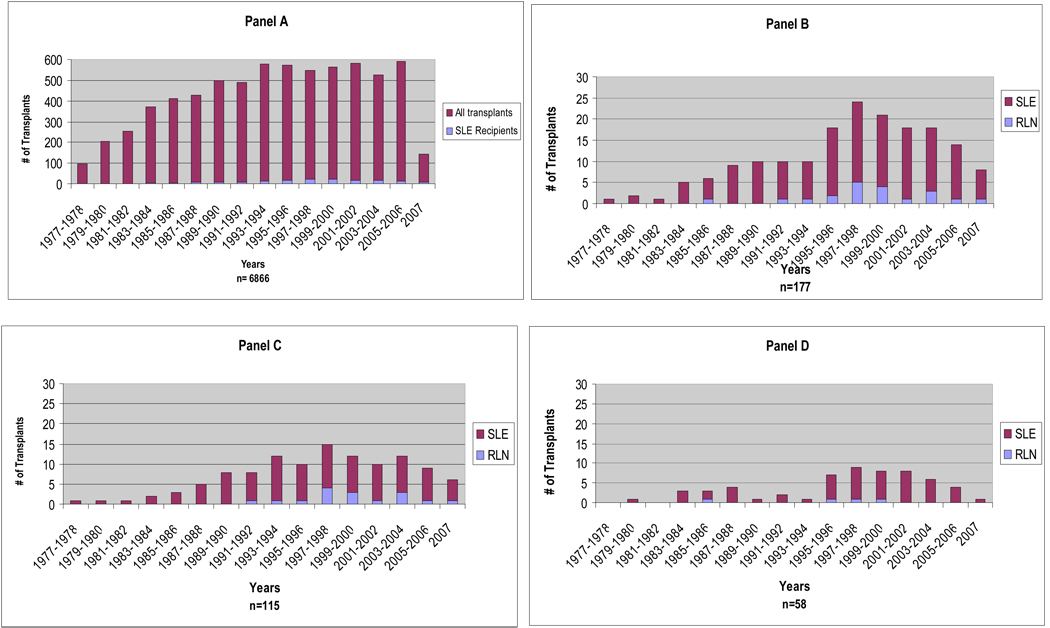
Figure 1.
Bargraft depicting the renal transplantation experience at the University of Alabama at Birmingham. Except from the last bar which represents the data from January to June 2007, all others depict the data for 2-year periods. Panel A. Number of renal transplantations performed in SLE recipients and all transplant recipients over the study period. Panels B–D. Proportion of recipients transplanted for lupus nephritis who developed recurrent disease. Panel B – All patients. Panel C – African Americans. Panel D– Caucasians.

